
Every company person will make many presentations about its corporation to many clients or investors. Free PowerPoint Infographics Pack is essential to visualize the data to be understandable by the audience is a bit tricky. Default charts in PowerPoint sometimes aren’t helping at all. The need for multipurpose PowerPoint Infographics and Charts assets is high, so that’s why we decide to make some.
You don’t need to worry about presenting your products when you have a PowerPoint asset. Company timeline, every cycle of your business, testimonials from clients, swot analysis, industry development, diagrams, infographics, social media, and other things are crucial.
A. Charts & Diagrams
Data Visualization often involves charts. As a graphical representation of data, they make complex numbers easier to understand and read. Column charts, bar charts, pie charts, line charts, bubble charts, gauges, radar charts, funnel charts, and Gantt charts are the most common charts
Diagrams also use visualization techniques to represent information. Specifically, diagrams show how something works and how the parts of a system interact.
We have assembled an extensive collection of editable and easy-to-customize charts and diagrams for every purpose and occasion. As soon as you need a visual representation of data, you can use them. You want your audience to be able to read and understand information more easily.
Choose from our wide selection of free charts and diagrams for PowerPoint and Google Slides! You have more than 2000 options to choose from!
1. Smart Chart
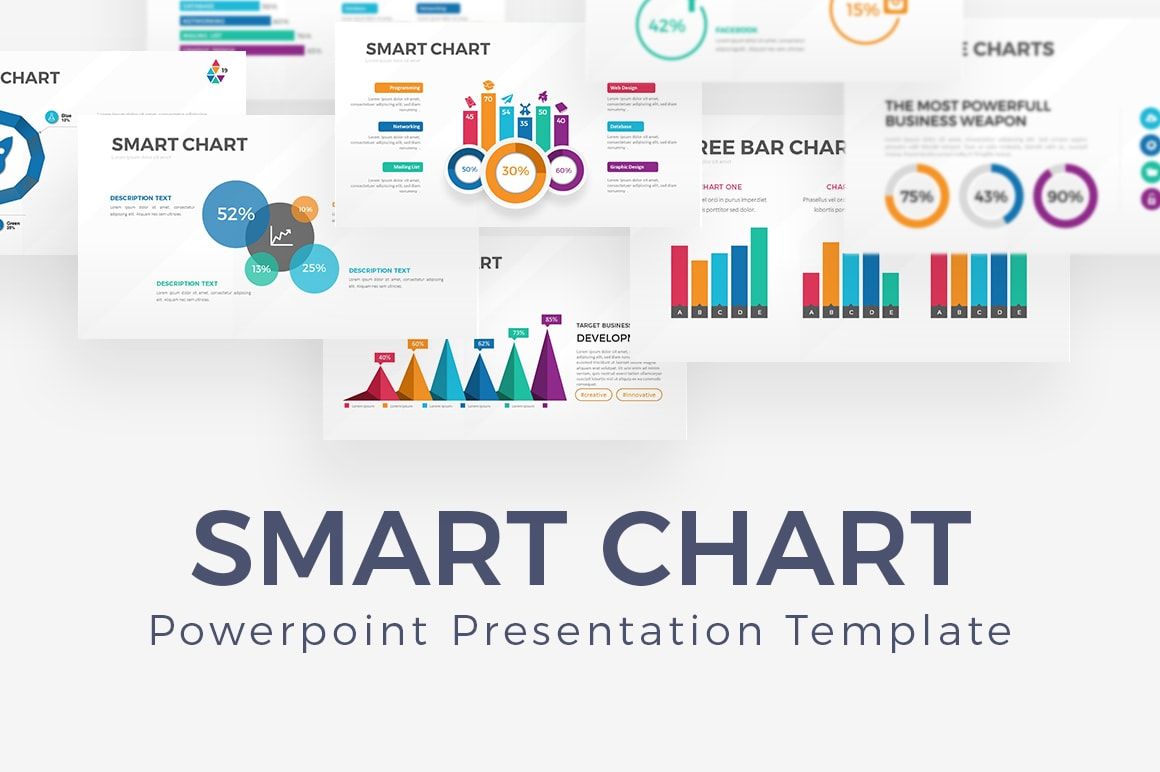
Smart Chart has various chart presentations, such as bar charts, analytic charts, smart charts, pie charts, gender smart charts, smart chart devices, social media charts, circle charts, analytical charts, arrow charts, triangle charts, creative charts, people charts, and many more that you can check and try. Complete right? You can choose a map that matches the data you want to display. You can also show extraordinary things with a light or dark version and color themes according to your favorite color or your company’s primary color.
2. Dashboard Infographic PowerPoint Template
Any business knows that there are multiple expenses and income flows that come each day. Our Dashboard infographics are perfect for those who are looking to represent all their numbers in a single place with charts. These Dashboards can be used to show income, expenses, statistics, employee productivity and so much more. Use these dashboard diagrams for any project, presentation, or monthly report. Our dashboards are also perfect for representing different global statistics to keep your company on track.
3. Calendar with Bar Chart Infographic Template
Check out our Calendar Infographic template! Easily edit this template to create a unique calendar for all your upcoming events and more.
4. Circle Donut Chart Infographic Template
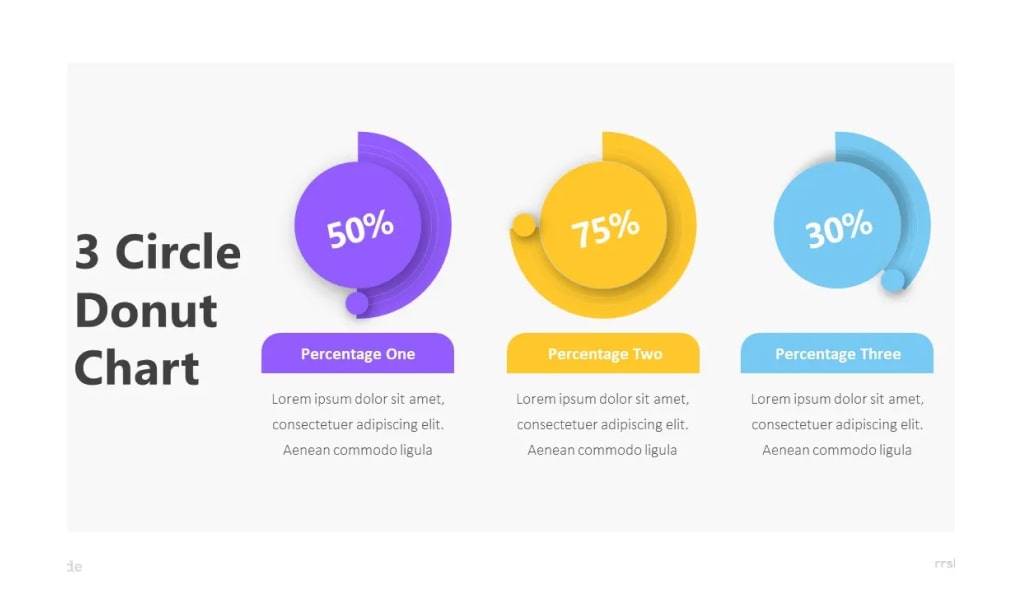
Customize the content by using this Circle Donut Chart. You can just copy and paste your content with a single click. Apply unique fonts with our font selector to make it professional, creative, or quirky.
5. Editable Gantt Chart Infographic Template
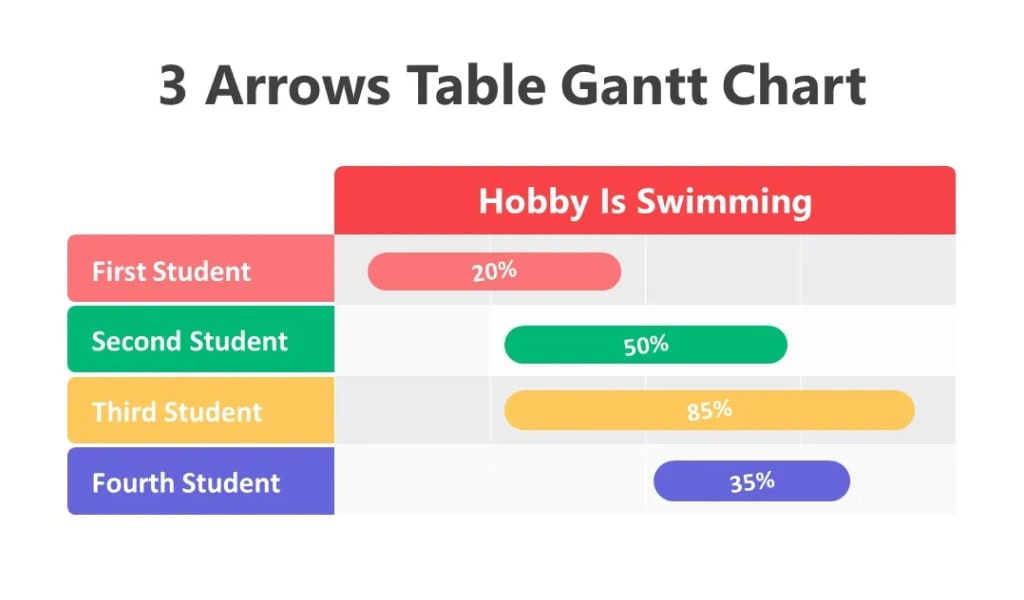
Create your own eye-catching Gantt Chart. Draw inspiration from a variety of color-matching principles or your own brand. If you’re not sure how to get started, take a look at our blog page for inspiration and guidance!
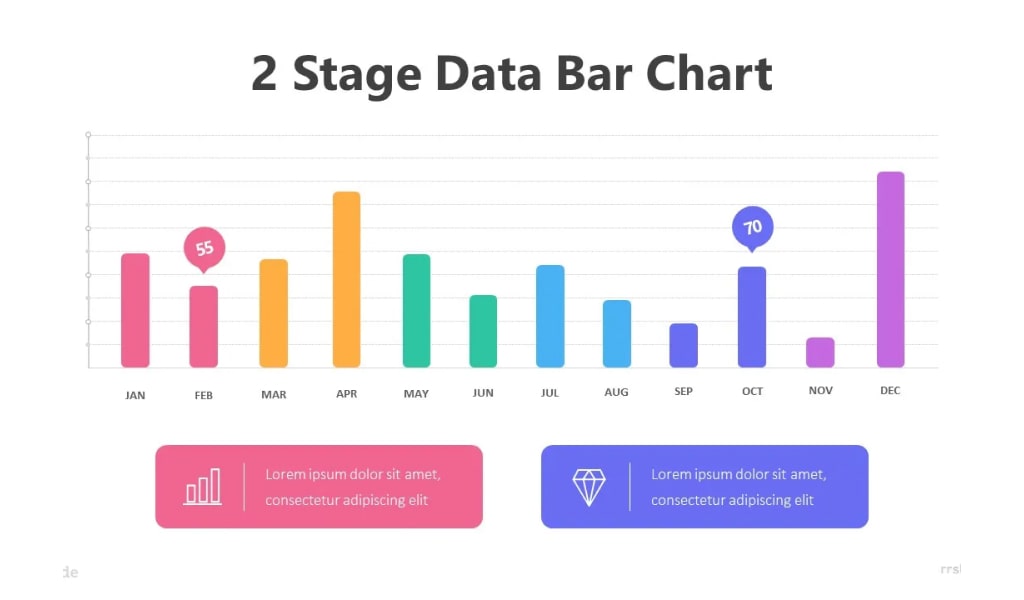
6. Stage Data Bar Chart Infographic Template
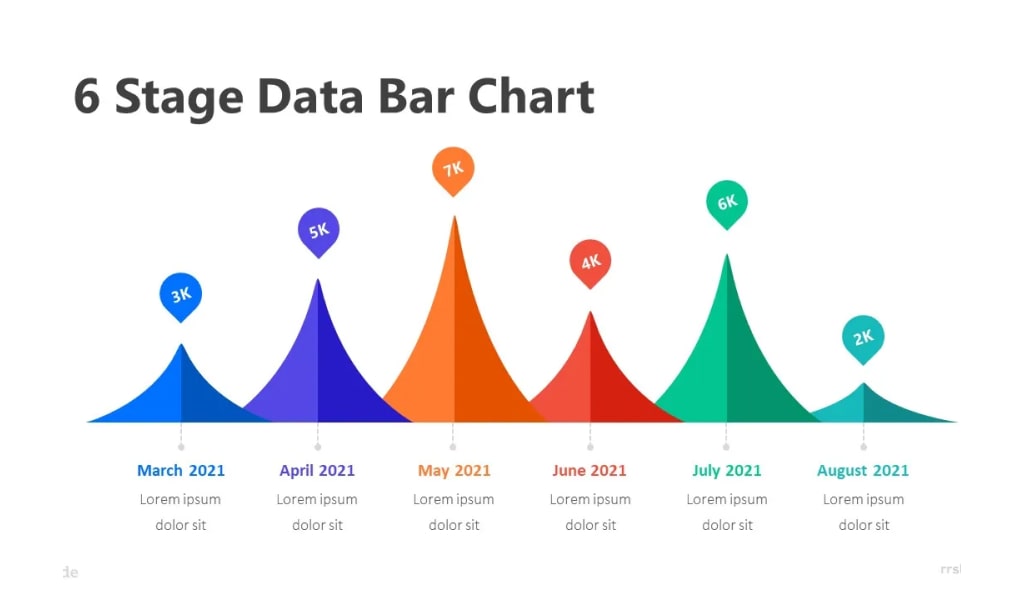
Not exactly what you were looking for? Take a look at our Stage Data Bar Chart for more timeline infographic templates.
7. 5 Options Gantt Chart Infographic Template
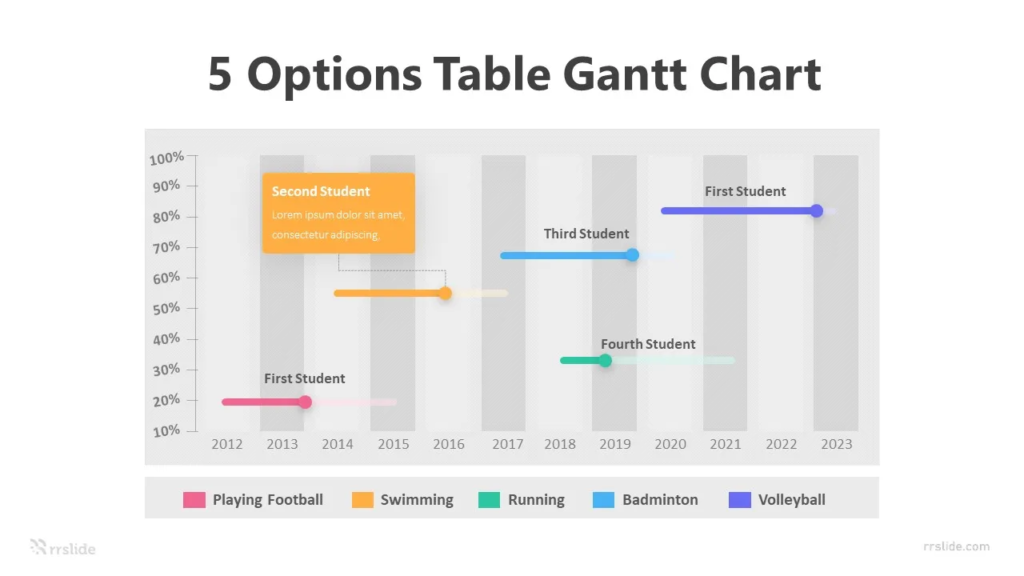
You can also add an extra design touch with the 5 Options Gantt Chart from the Infographic Library. In minutes you’ll have a creative timeline design and ready to share!
8. 6 Analysis Bar Chart Infographic Template
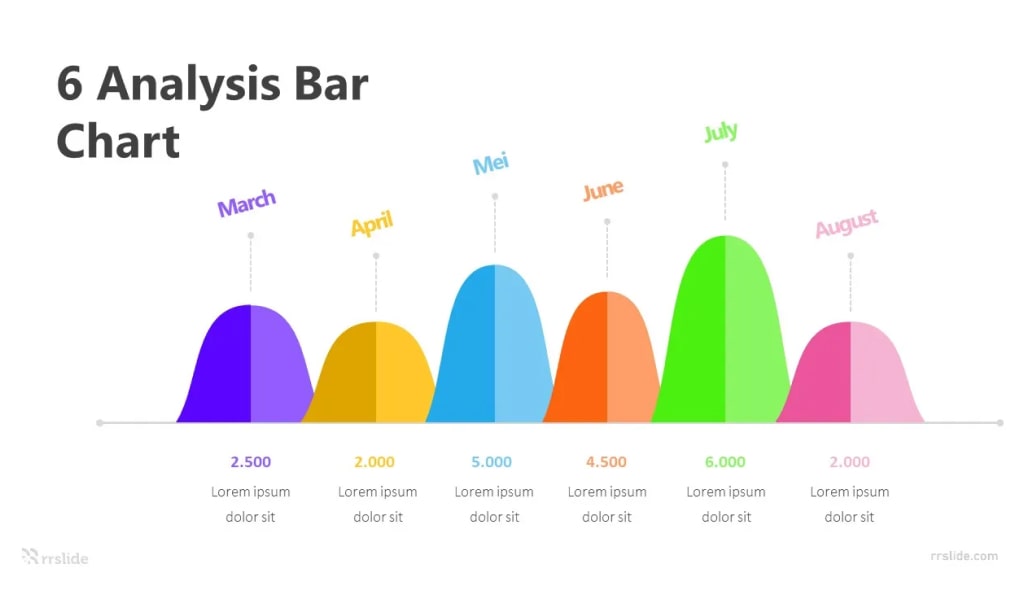
Technical analysts use bar charts—or other chart types such as candlestick or line charts—to monitor price action, which aids in trading decisions. Bar charts allow traders to analyze trends, spot potential trend reversals, and monitor volatility and price movements.
9. 4 Stage Social Media Bar Chart Infographic Template
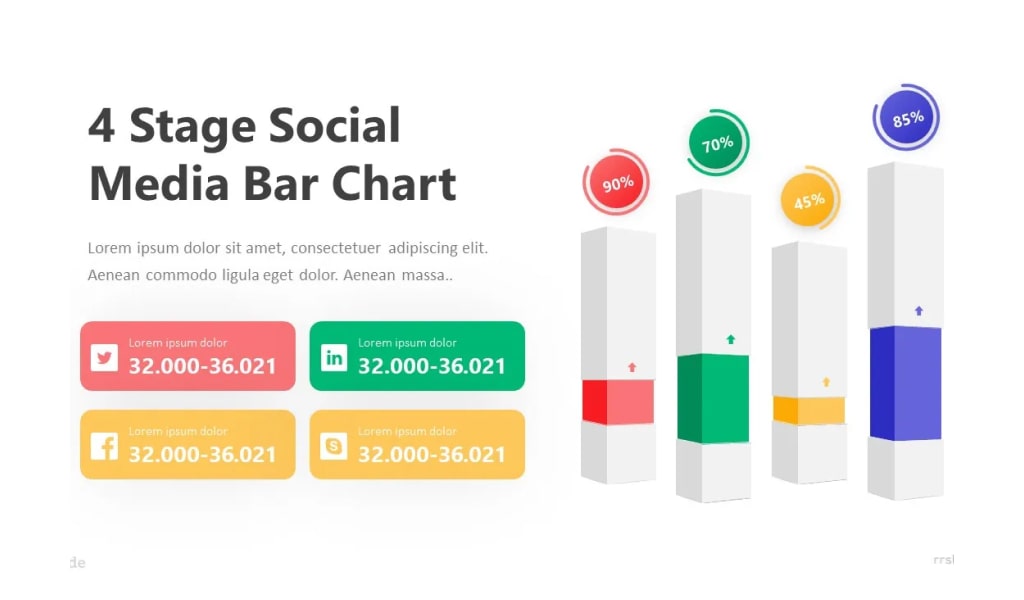
The best way to reach your audience with this type of visual content is through social media. But creating a social media infographic can be a little different than creating one for your website, blog, or email newsletter. Check out these 4 Stage Social Media Bar Chart Infographics for your social media strategy. With this chart, you’ll learn more about creating infographics specifically for social media, how to share these on each platform, and how to increase followers and engagement.
10. 4 Bubble Chart Infographic Template
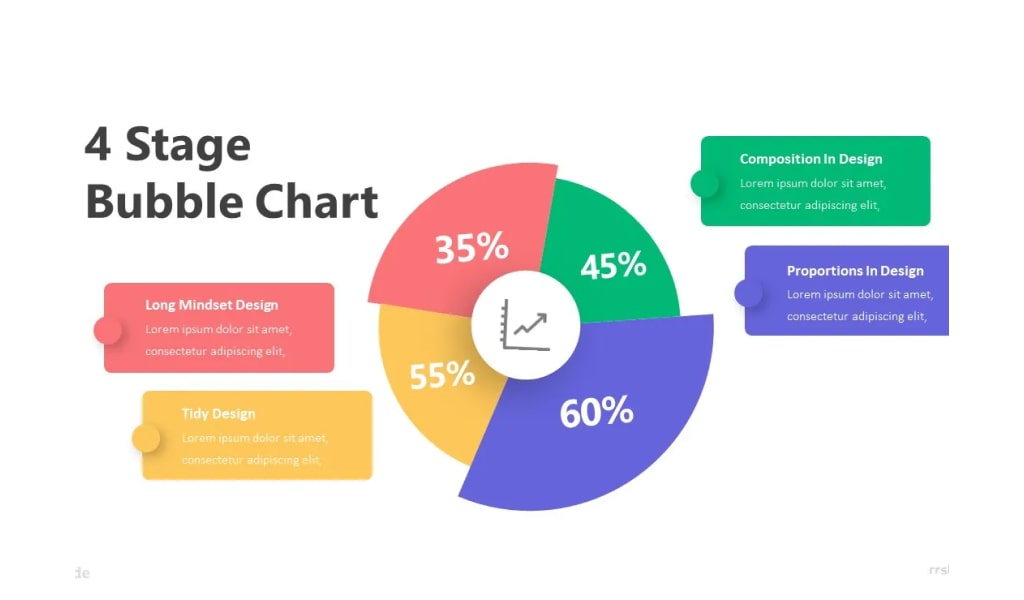
This 4 Bubble Chart template is perfect for visualizing at least three related dimensions of data.
11. 4 Step Donut Chart Infographic Template
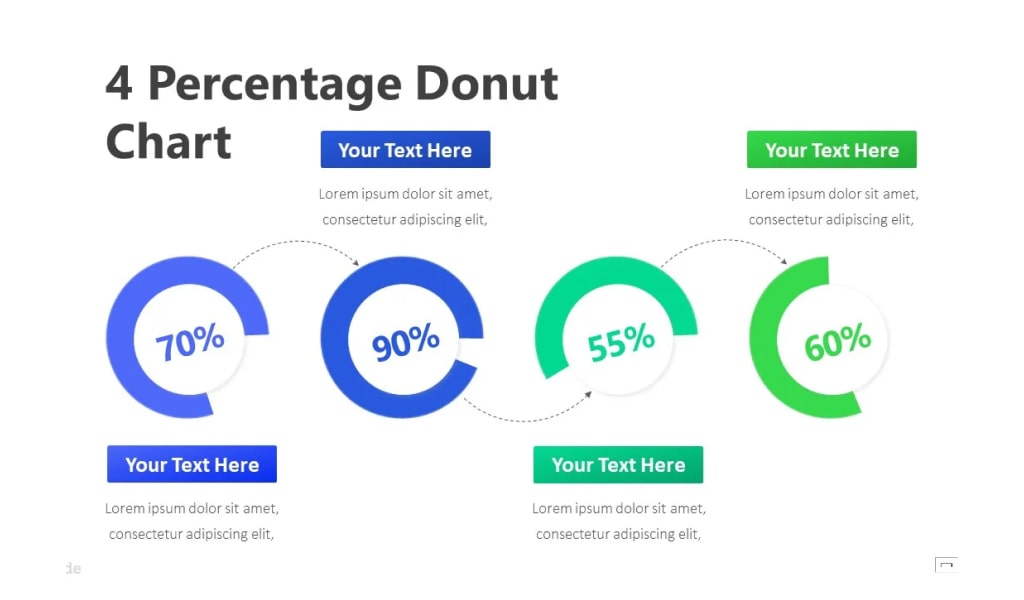
A donut chart is essentially a Pie Chart with an area of the center cut out. 4-Step Donut Chart somewhat remedies this problem by de-emphasizing the use of the area. Instead, readers focus more on reading the length of the arcs, rather than comparing the proportions between slices. Also, this chart is more space-efficient than Pie Charts because the blank space inside a Donut Chart can be used to display information inside it.
12. 6 Stage Business Pie Chart Infographic Template
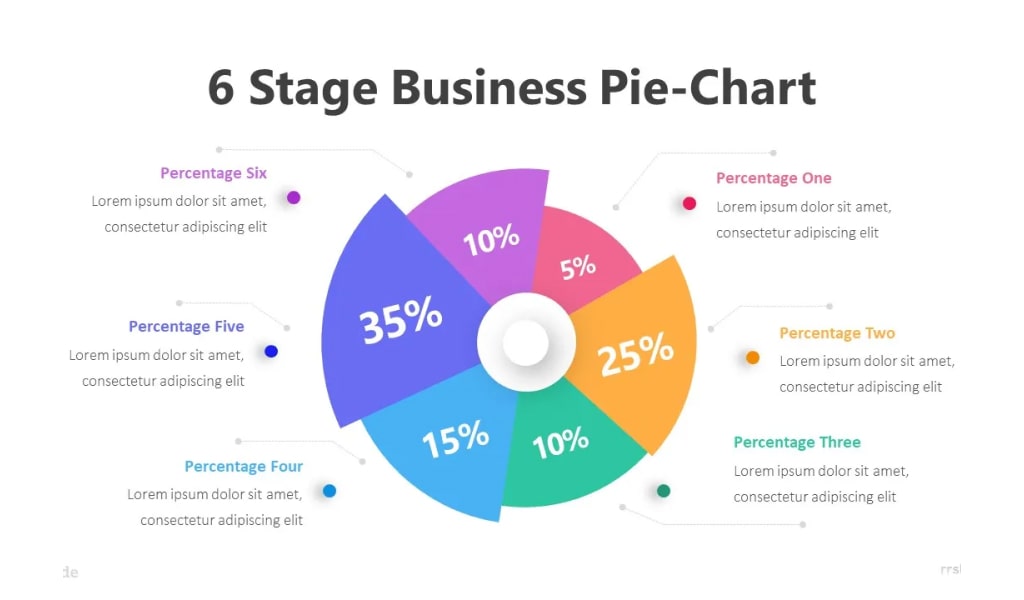
6 Stage Business Pie Chart shows the parts-to-whole relationship. This chart is a circle that is divided into areas, or slices. Each slice represents the count or percentage of the observations of a level for the variable. This pie chart is often used in business.
13. 4 Stage Pie Chart Infographic Template
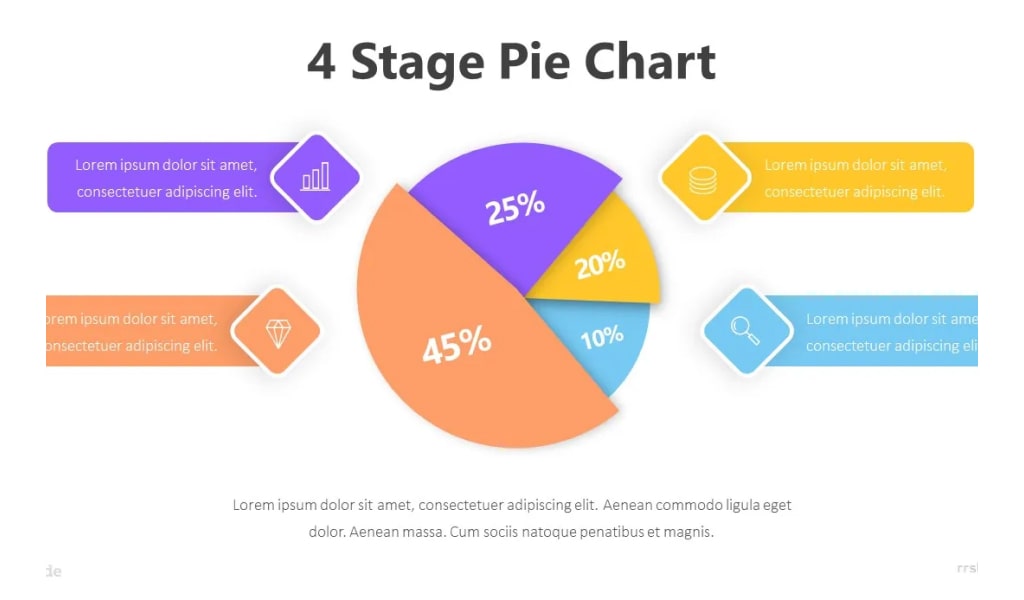
Pie charts are very widely used in the business world and the mass media. However, they have been criticized, and many experts recommend avoiding them, as research has shown it is difficult to compare different sections of a given pie chart or to compare data across different pie charts. Pie charts can be replaced in most cases by other plots such as the bar chart, box plot, dot plot, etc.
14. 5 Stage Business Pie Chart Infographic Template
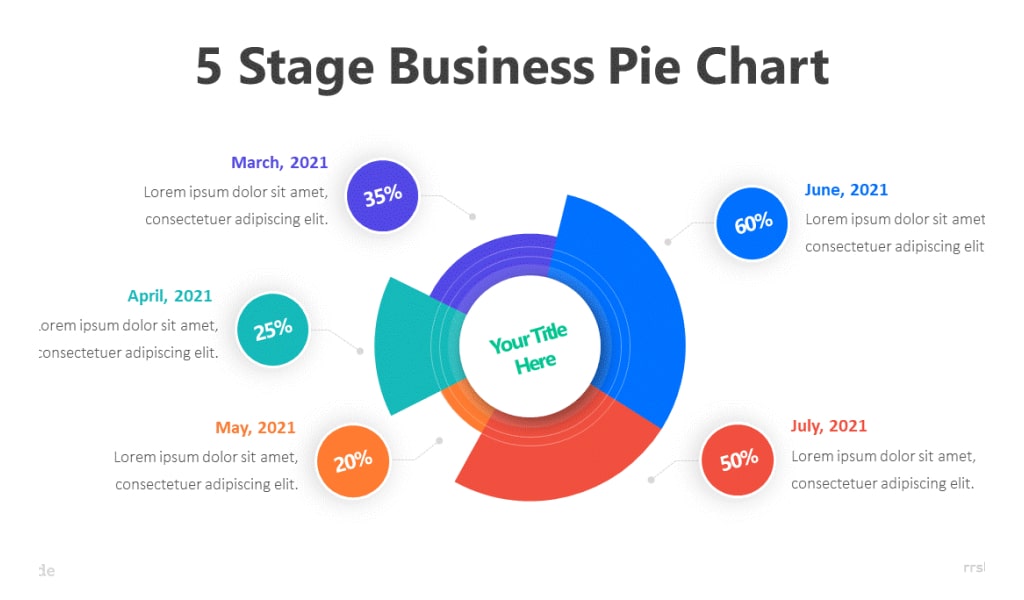
It is a really good way to show relative sizes: it is easy to see which movie types are most liked, and which are least liked, at a glance. You can create graphs like that using this 5 Stage Business Pie Chart Infographic Template.
15. Free Pie Chart Infographic Template
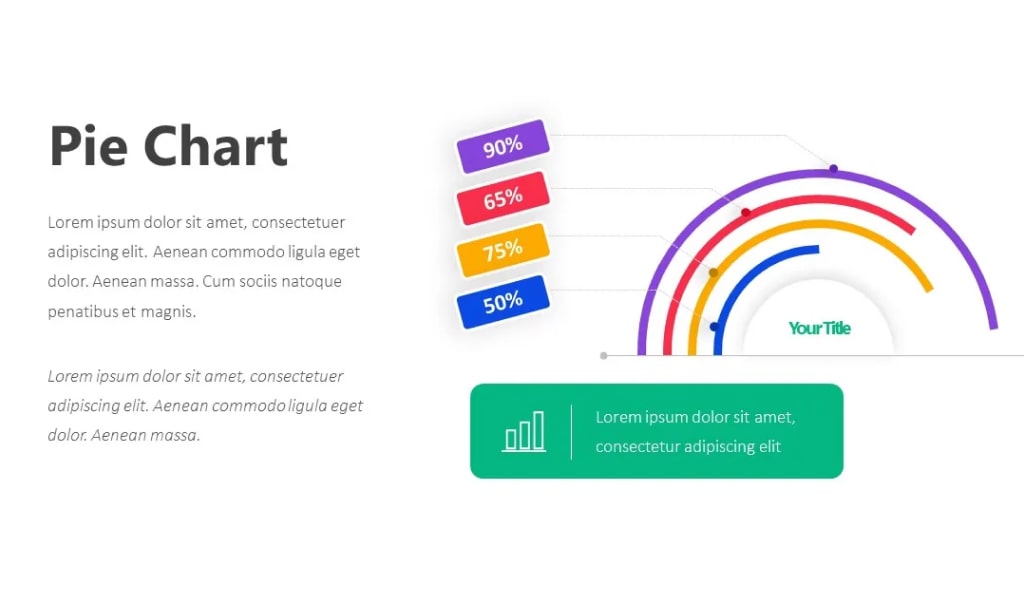
Make your data visualization design as painless as possible by getting started with a premade pie chart template. Create a pie chart by simply editing and customizing the template of your choosing. Input your data, customize fonts and colors, and download.
16. Business Organization MindMap Infographic Template
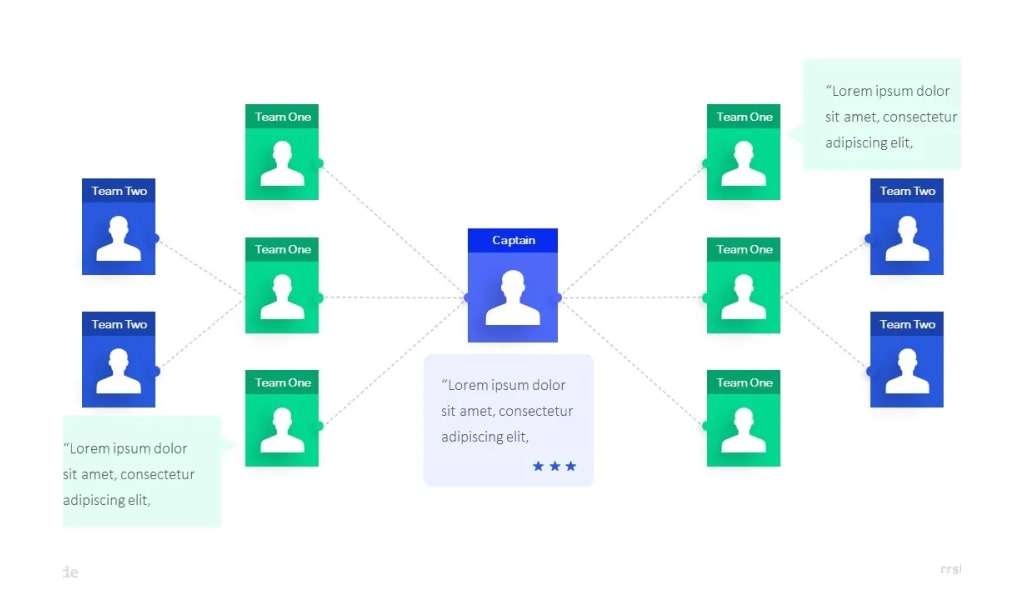
Mind mapping provides a flexible way to capture, organize, and prioritize information and actions in a single view. Mind maps also help you see both the big picture and the small details. They allow you to break down big tasks that can feel overwhelming into smaller, more manageable steps. Let’s start with creating your mind map.
17. Organizational Chart MindMap Infographic Template
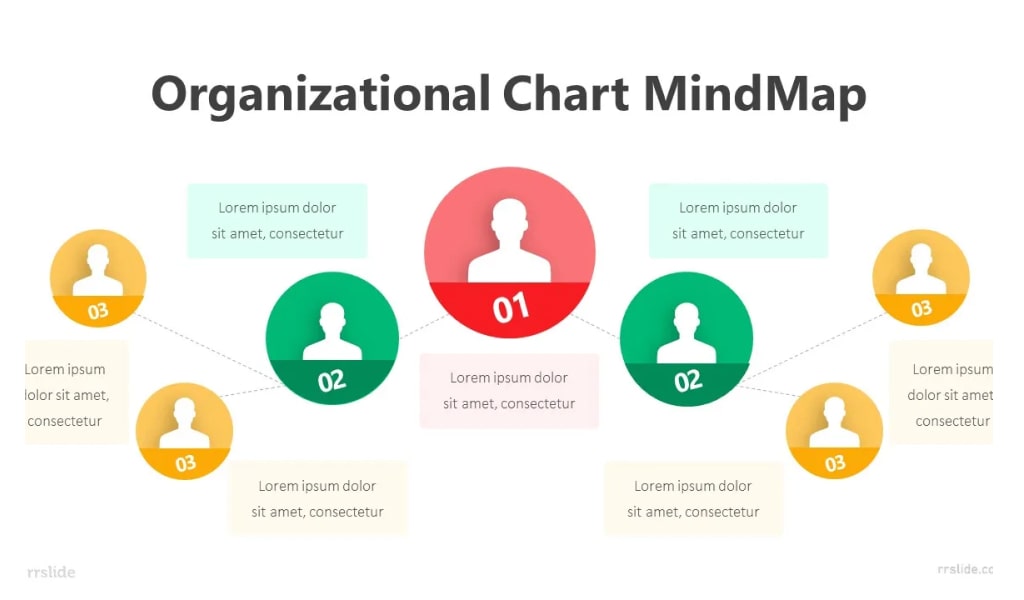
When you think of presentations, you probably think of static slides depicting information in a linear, text-heavy way (like bullet points). Each slide is independent of the others and it’s hard to see the big picture of how all this information is related to each other. With a presentation mind map, the central subject focuses on audience comprehension. You want to make sure that team members and stakeholders understand the idea you are presenting. Presentation mind maps give the audience a bird’s-eye view of how everything fits together.
18. 3 Stage Dashboard Infographic Template
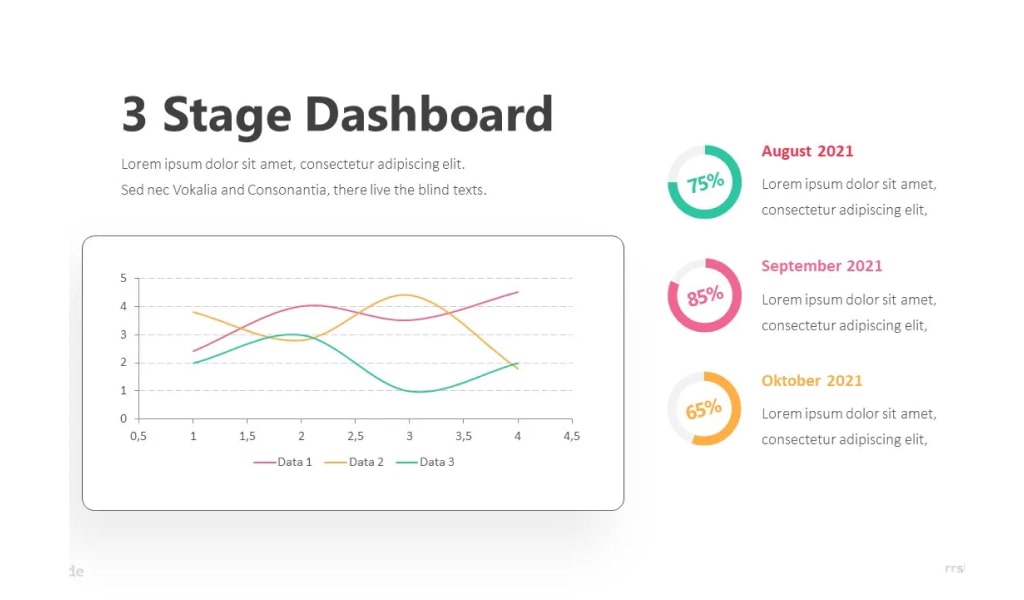
Present this set of slides with 3 Stage Dashboard Infographic Template. The topics discussed in these slides are the KPI Dashboard. This is a completely editable PowerPoint presentation and is available for immediate download. Download now and impress your audience.
19. 3 Stage Stopwatch Chart Infographic Template
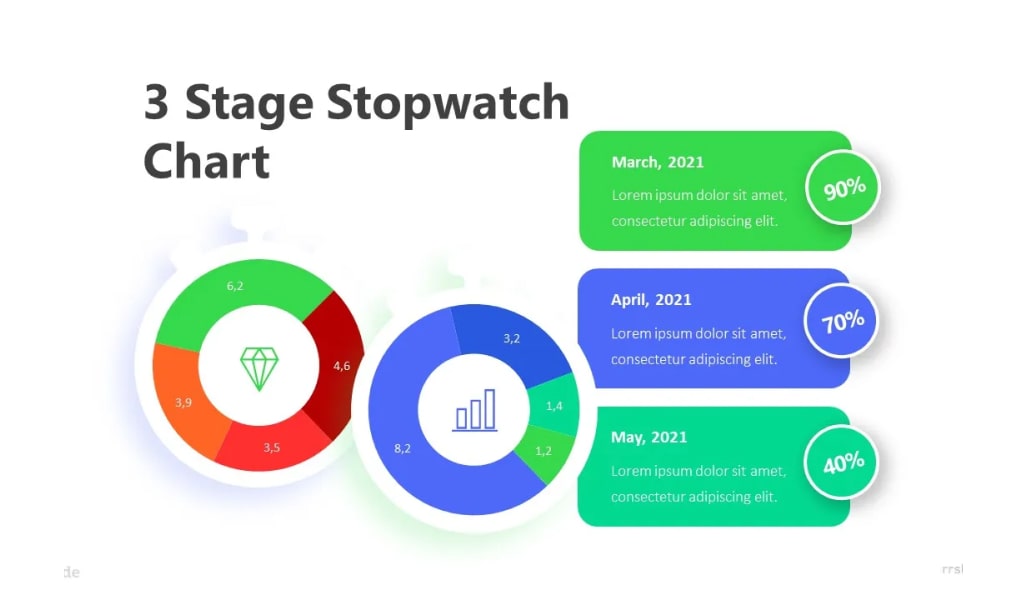
Looking for a simple 3-Stage Stopwatch Chart Infographic? Nothing says countdown like a clock chart. A bit more visual for students. Try this on your presentation project!
20. 6 Option 3D Column Chart Infographic Template
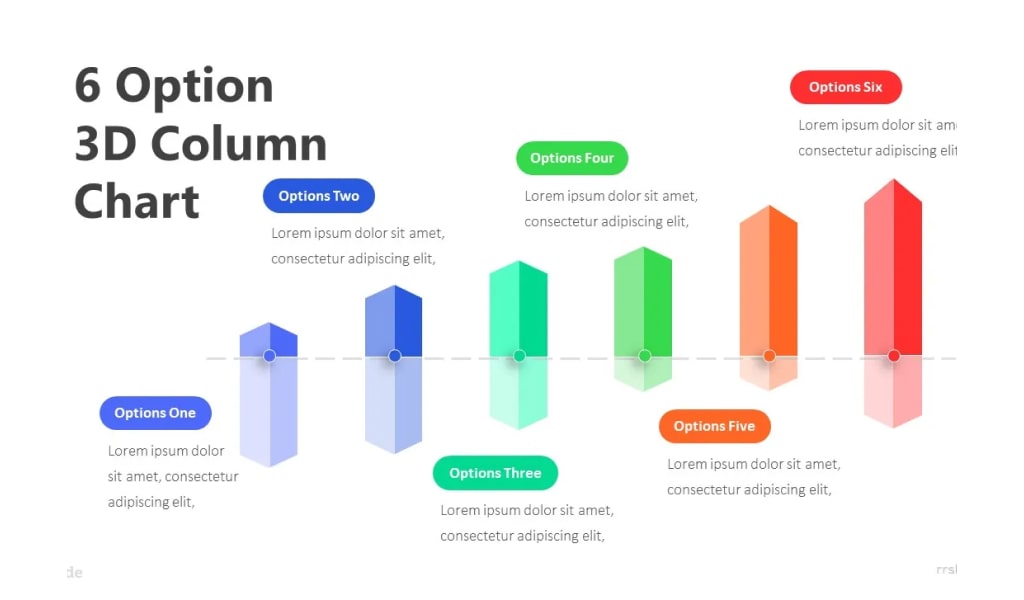
6 Option 3D Column Chart shows the changes in a data series over time or compares multiple items. Types of items are arranged horizontally and data values are plotted vertically to emphasize variation over time.
21. 3D Bar Chart Infographic Template
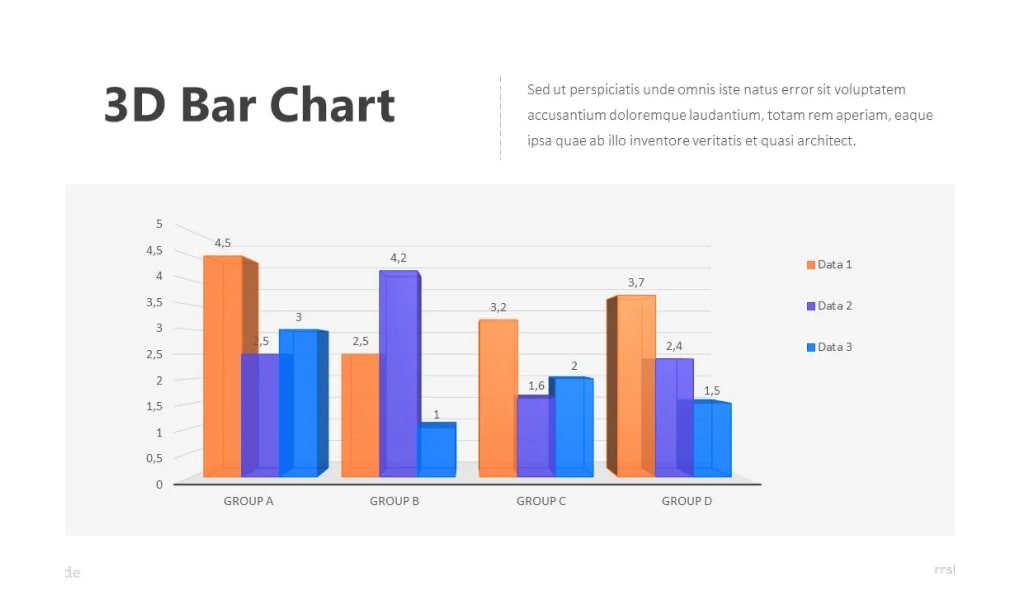
3D Bar Chart Infographic represents the regions where a company makes sales and retails, emphasizing the fact that all sales of one product make a whole by making the chart of stacked type.
22. 2 Columns Comparison Bar Chart Infographic Template
2 Columns Comparison Bar Chart Infographic Template comes in your hand to help you create ready-fresh charts, diagrams, mockups, maps, and many more. Take your pick in our wide collection of free infographics for PowerPoint, Keynote, and Google Slides! More than 100 options are waiting for you! If you need to give a business, marketing, finance, science, or any other professional presentation, the tool you are looking for is just one click away!
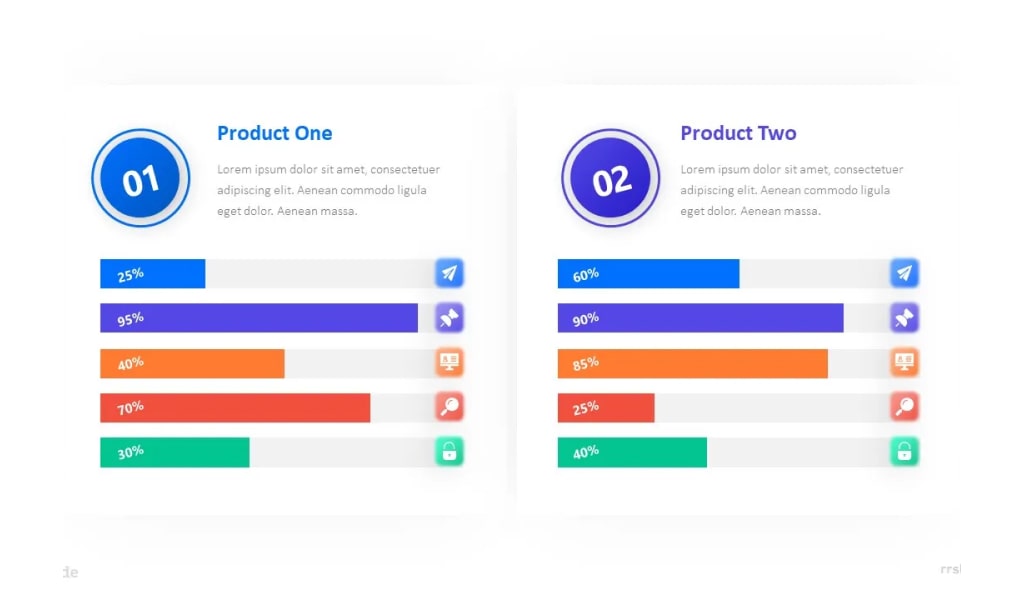
23. 2 Product Comparison Bar Chart Infographic Template
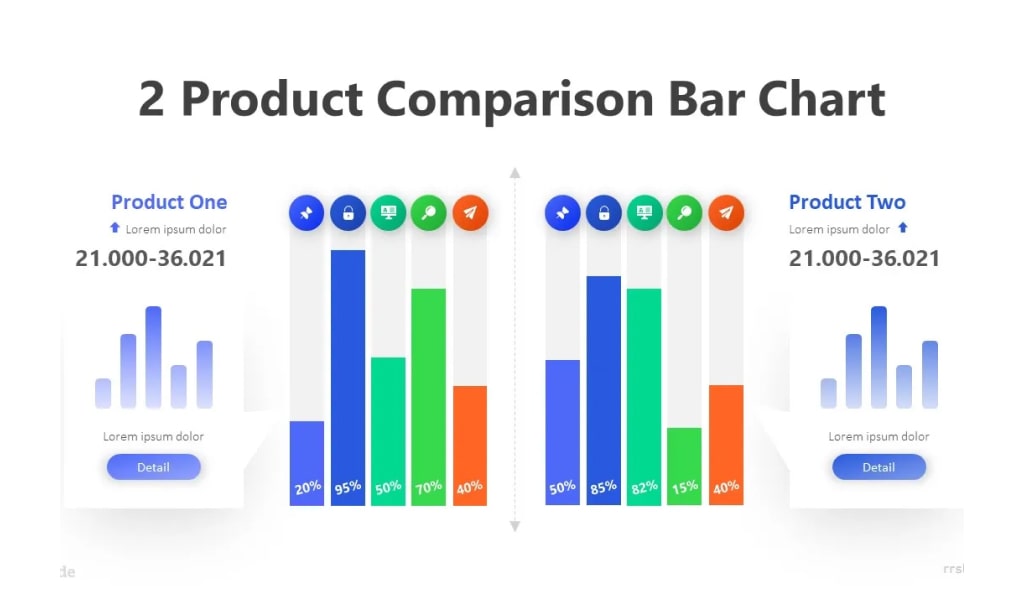
2 Product Comparison Bar Chart Infographic Template comes in your hand to help you create ready-fresh charts, diagrams, mockups, maps, and many more. Take your pick in our wide collection of free infographics for PowerPoint, Keynote, and Google Slides! More than 100 options are waiting for you! If you need to give a business, marketing, finance, science, or any other professional presentation, the tool you are looking for is just one click away!
24. Line Chart Business Readiness
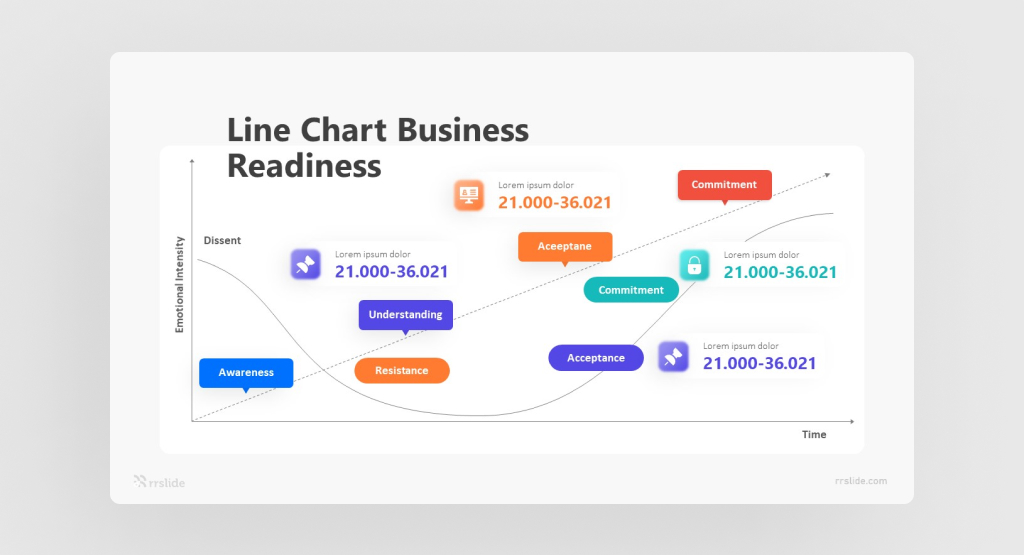
Line Chart Business Readiness is line charts that can be used for various information sets. This chart is great for illustrating comparisons by period because it allows people to see the linear relationship between two different values and understand changes and trends over time. An example would be line graphs showing prices or percentages over time.
Line charts quickly caught on as a way for businesses and other organizations to show statistical information about their operations or those that influence them because line charts are an effective way to visualize information. Through line graph templates, we can help all kinds of businesses and organizations to understand their information, increase engagement with customers and stakeholders, communicate information more effectively, and improve internal operations that show information clearly and accurately.
25. Organization Chart
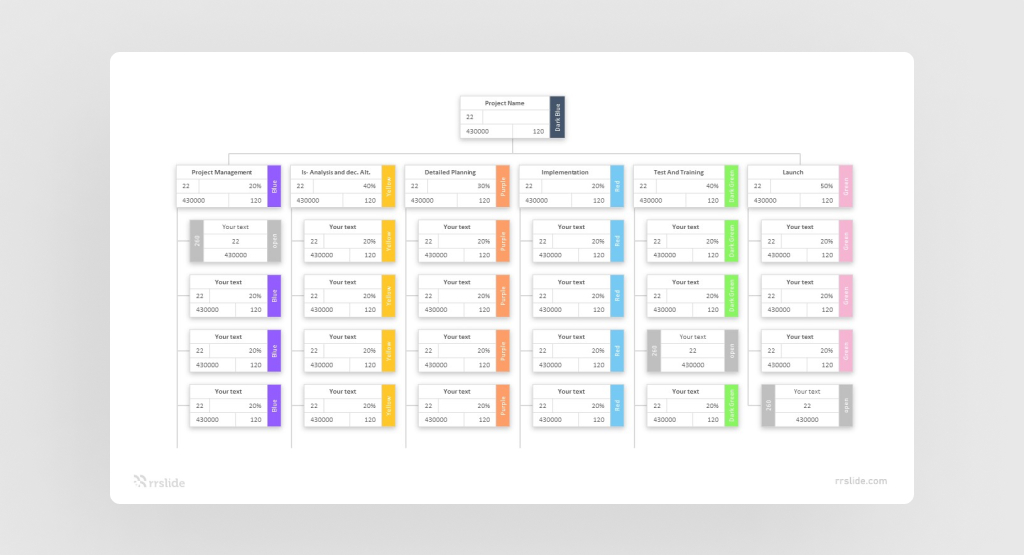
A corporate organizational chart template is a diagram that shows the relationships between different parts of an organization, including its managers and employees. It shows which managers oversee other employees and how they report to one another. The corporate organizational chart template can be used to help visualize the hierarchy of a company, as well as track employee roles and responsibilities. It can also be helpful for planning and communication purposes. RRSlide offers several different types of free PowerPoint infographic templates, which you can customize to fit your organization.
26. 4 Step Relationship Chart
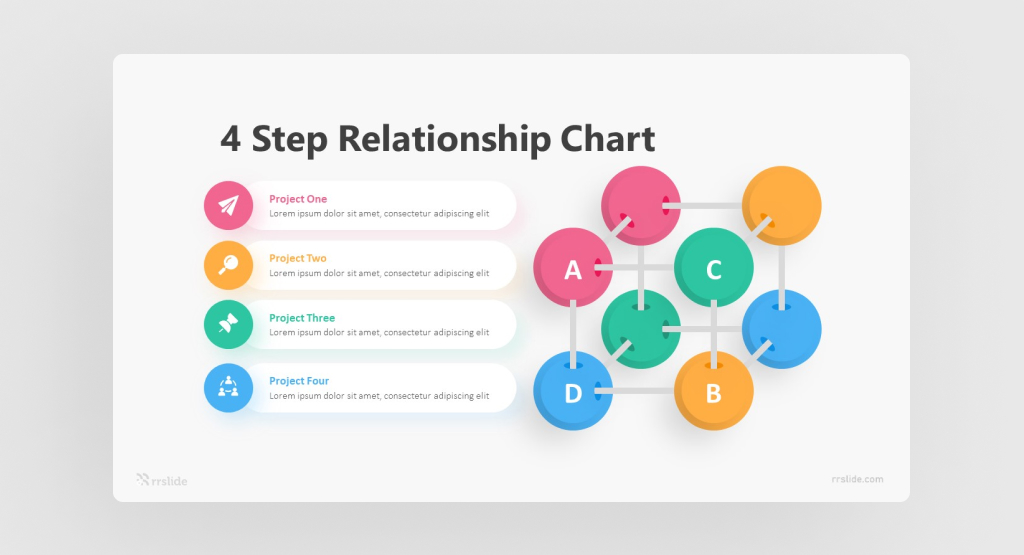
A 4-Step Relationship Chart is a diagram that illustrates a workflow, procedure, or system. These flowcharts typically depict the order of steps or tasks involved, often using lines or arrows to direct the flow of information.
It can visualize the steps in a procedure, organize the flow of work, or highlight important decisions required to complete projects. These amazing flowchart examples with their many use cases may help you apply the format to tackle problems in your organization.
27. Line Chart Financial Plan
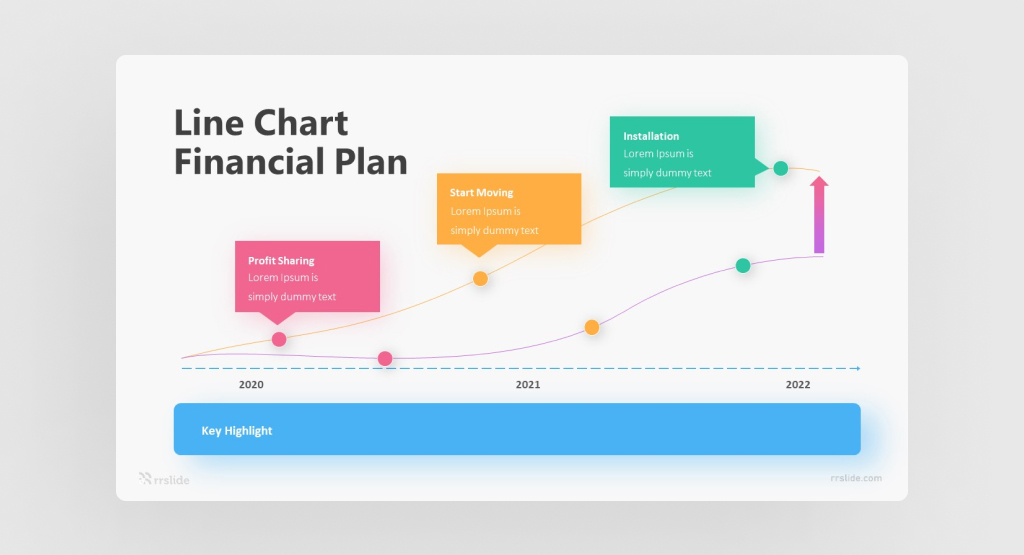
A line chart is used to represent information over a continuous time span. It generally shows a measured trend (or a variable) over time. Statistics values are plotted as points that are connected using line segments.
Using a line chart, one can see the pattern of any dependent variable over time like share price, trading, finance, EPS (Earnings Per Share) of a company, recordings (like temperature, precipitation, or humidity), etc.
28. 5 Stage Diversity Inclusion
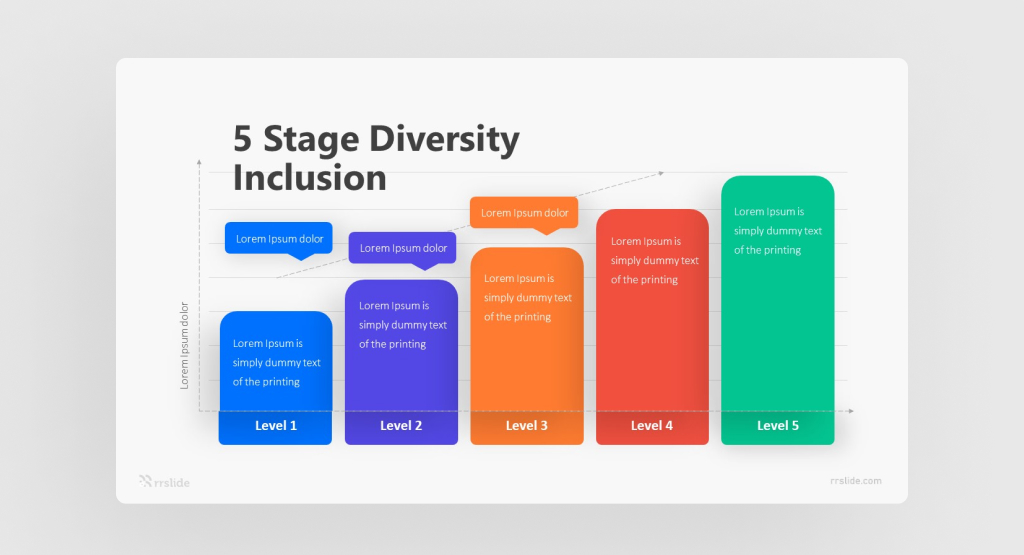
Your Diversity and Inclusion Strategy should outline your vision and tell you which areas need priority attention. It should also explain why and how diversity and inclusion underpin your overall company mission or vision and how they align with your values.
Not only is improving diversity and inclusion in the workplace an obvious ethical responsibility but it’s also proven to bring better results for organizations. From boosting innovation to helping teams perform better and retaining top talent, diversity and inclusion bring many benefits. But the real question is, what steps can a company put in place to ensure it reaps the benefits of a more diverse and inclusive workforce?
29. 4 Step Circle Process Diagram
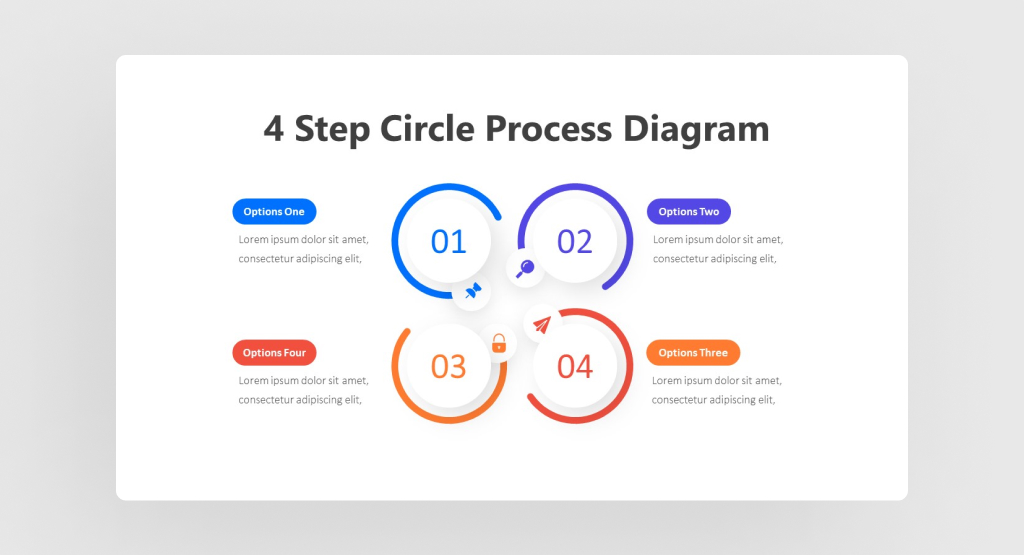
4 Step Circular Flow Diagram is a simple model designed to illustrate different concepts. This is a creative display of four orbiting planets. Each compact disk design creates a rotation feeling because of the orbit appearance. The diagram shows the circular flows with four circle units to highlight four steps. This circle diagram PowerPoint template or firm cycle is suitable for discussing stages of various operations. For instance, product development phases, corporation life cycle, continuous change, and process improvement models. Besides, the 4 step procedure diagram demonstrates an interrelated sequence of processes in the cycle.
This diagram is an ideal slide for presenting marketing concepts. The circles’ changing size or decreasing size is suitable for marketing presentations with a prioritizing edge. The presenters can provide innovative and novel marketing theories using free infographic templates. Presenters can deliver their concepts in an easy-to-understand style with flexible illustrations. Organizational goals can be achieved through marketing concepts. Social media marketing has proved its vital presence in selling products/services in the digital world. So, the presenters can display four important elements of social media marketing and its advantages.
30. 3 Options Funnel Diagram
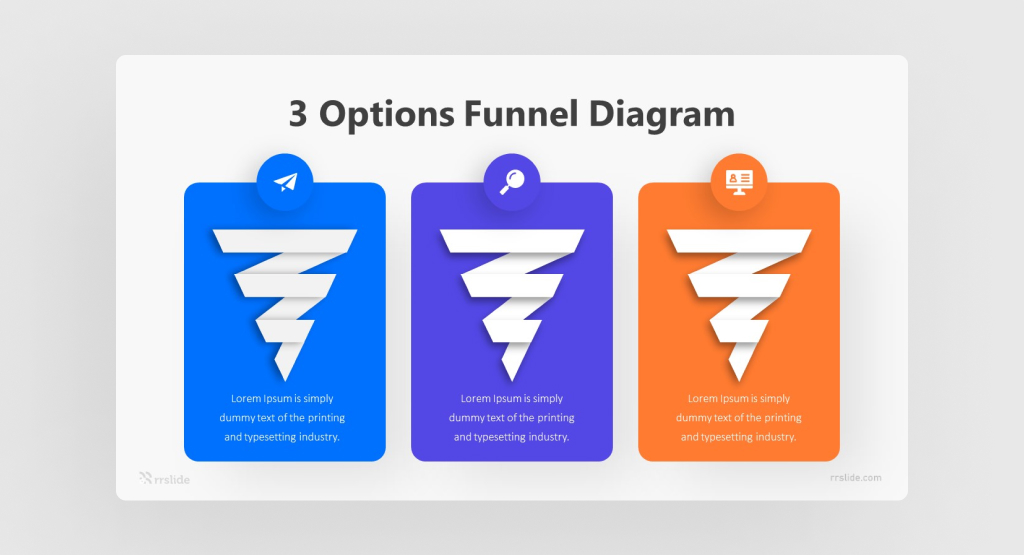
3 Optional Funnel Diagram is a specialized chart type that demonstrates users’ flow through a company or sales. The chart takes its name from its shape, which starts with a broad head and ends with a narrow neck. The number of users at each method stage is indicated by the funnel’s width as it narrows.
Funnel charts are most often seen in firm or sales contexts, where we need to track how a starting set of visitors or users drop out of a flow. This chart type shows how the starting whole breaks down into progressive parts. By visualizing the number of users that make it to each stage of the procedure, a business can understand where there are significant drop-offs and try to make changes to the user experience for the better. Note that there will not be enough detail in a funnel chart to say why an unexpected drop has occurred, so funnels are best used as a high-level visualization before moving into a deeper investigation.
31. 3 Career Development Plan
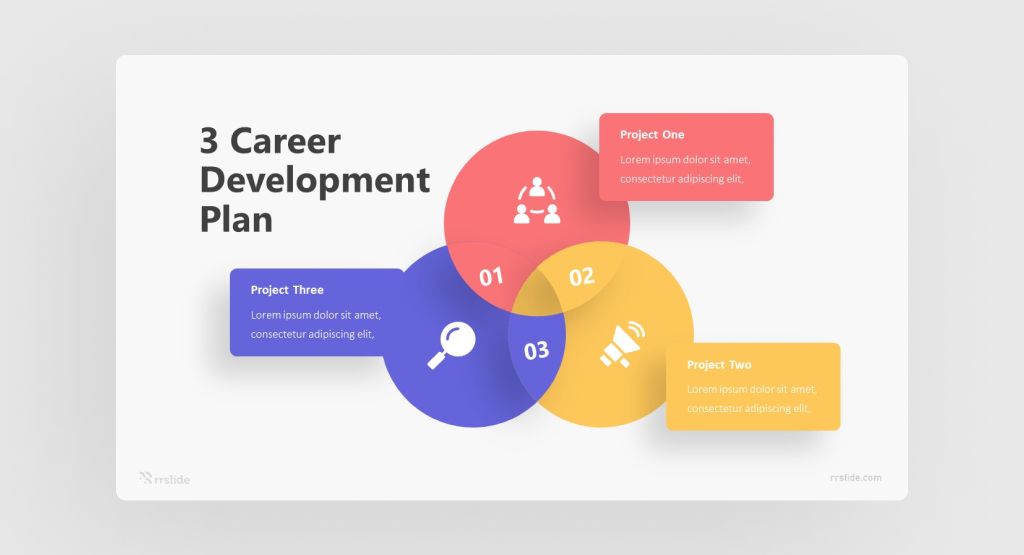
The 3 Career Development Plan provides a comprehensive framework for assessing skills and establishing learning outcomes that demonstrate knowledge of self, career paths, and academic and career opportunities. Career decision-making is a strategy, and you can set your own pace in pursuing career development accordingly. If you work with a career coach and take advantage of the CEC’s programs and resources, you will be better prepared to make informed and meaningful career decisions.
32. 7 Stage Layer Diagrams
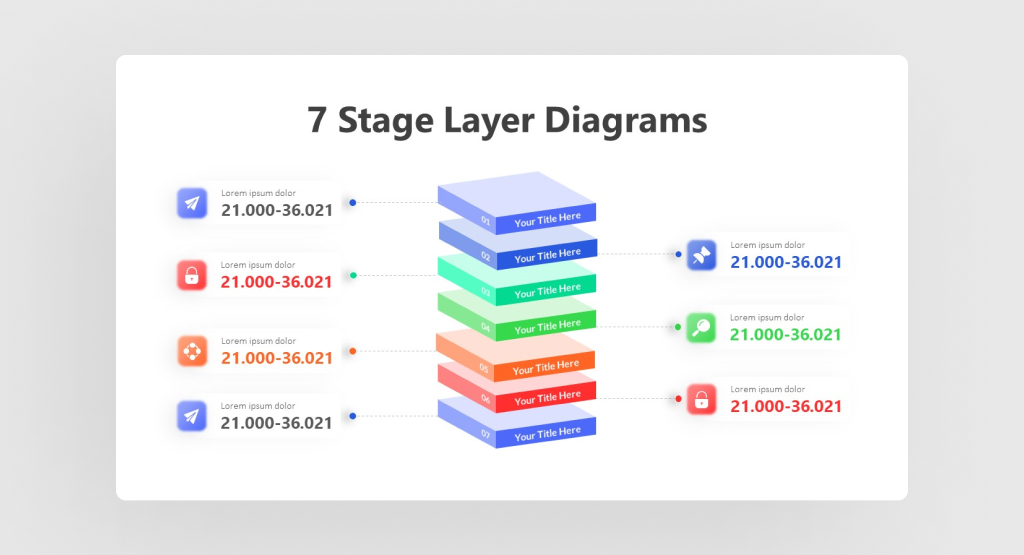
Create modern presentations with multiple stages using the 7 Stage Layer Diagrams. The red, violet, and yellow color scheme makes each layer stand out against the plain presentation background. The multi-step diagram design is created in a PowerPoint template to prepare PowerPoint presentations with artistic 3D and perspective effects.
Most enterprise plans have several layers that represent stages of implementation. In marketing plans, these stages can represent levels of market penetration. In generic company plans, the stages can refer to specific construction phases or implementation of the plan itself. Most of these stages begin with generic elements before going in-depth to more specific elements.
The slide designs allow the presenter to show five stages of the plan. These can be presented vertically to demonstrate the level of priority for each stage or horizontally to show their position in a timeline. The segments can be removed to show stages that can be skipped or those that are irrelevant to the discussion.
33. Pharmacy Infographic
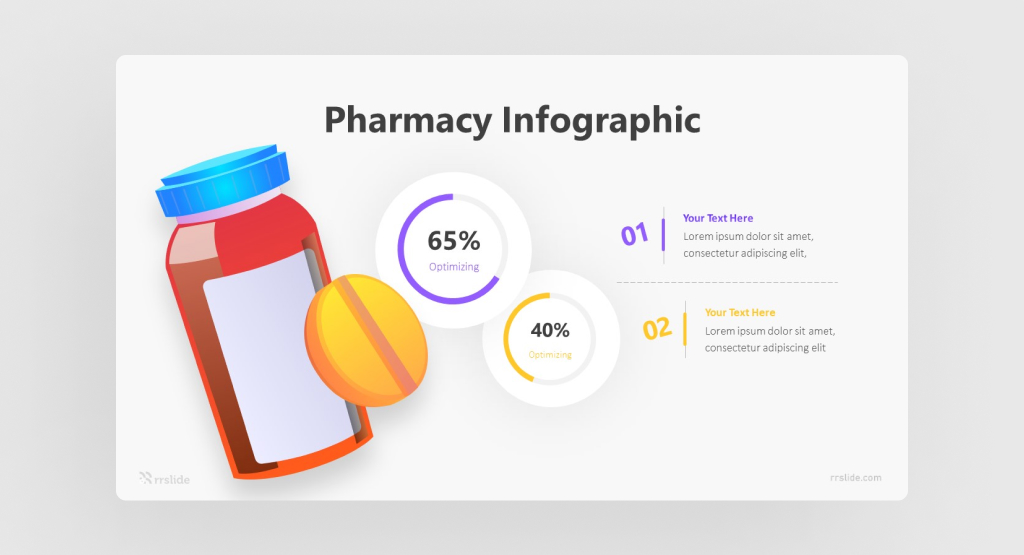
Use this infographic to talk about medicine or pharmacy. For example, you can use these design icons to show a new medication or provide some statistics on a specific treatment. Since healthcare is a serious matter, upping your game and making your message more visual helps your audience be receptive to the topic.
34. 8 Step Tube
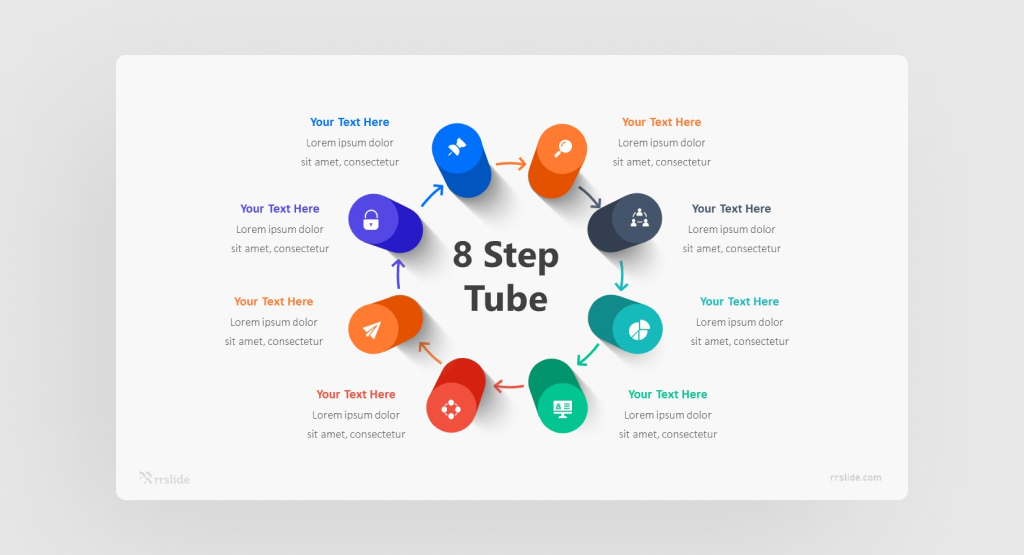
The 8-Step Tube Diagram is a test tube-shaped bar chart. It can be modified by simple numeric input. It also some editable graphics with text and icon placeholders. This diagram is a design divided by eight parts of the test tube liquid. This is good for explaining the step-up concept. It is also an editable graphic with text and icon placeholders.
35. 4 Step Project Timeline
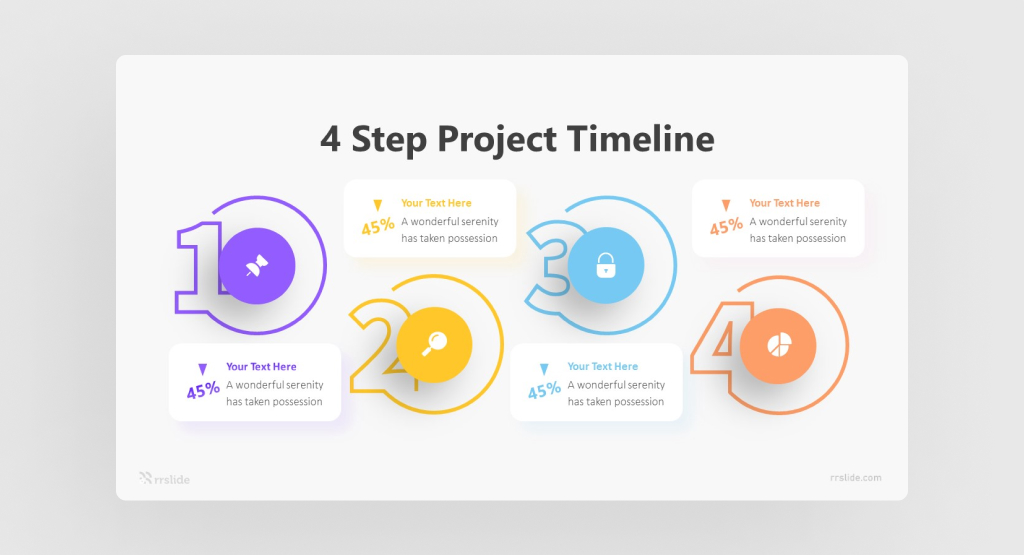
No project plan or charter is complete without a project management timeline. Project management timelines provide a simple visual overview of a project from start to finish and increase work efficiency among teams. As simple as timelines appear when you see them on paper, breaking down a project into an effective timeline may feel overwhelming, especially to novice project managers. So, if this is your first experience creating a project management timeline, use these eight no-fail steps to perfect your next timeline.
36. 4 Options Business Review
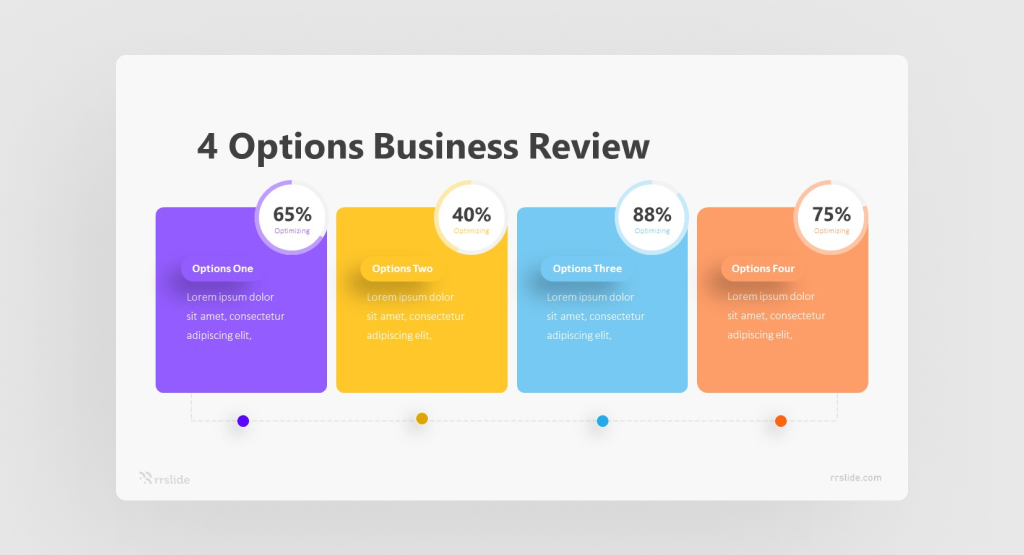
4 Options Business Review comes in your hands to help you create ready-fresh charts, diagrams, mockups, maps, and many more. Take your pick in our wide of free infographic collections for PowerPoint templates, Keynote, and Google Slides! More than 100 options are waiting for you! If you need to give a firm, marketing, finance, science, or other presentation template, the tool you are looking for is just one click away! Since there is a chart for every objective and a diagram for every occasion, we have assembled a varied and extensive selection of editable and easy-to-customize charts and diagrams. The aim is to make understanding and information easier for audiences.
37. Business Analyst Hierarchy
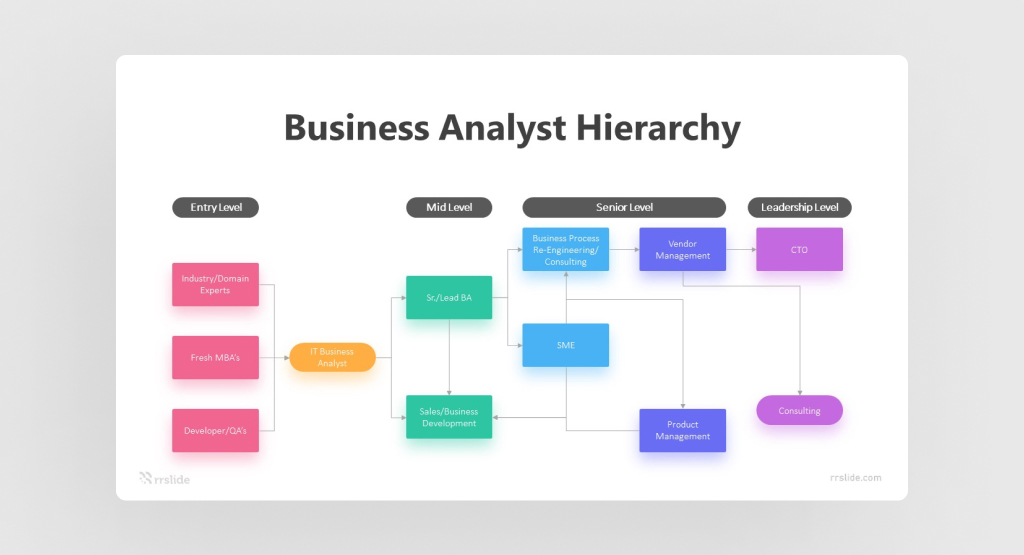
The corporation analysis models come into play when understanding stakeholders’ requirements in every organization whilst identifying opportunities for growth and problem areas that need attention. While there are many areas to look at, it would consume more time unless you have the correct tools at hand.
Business Analyst Hierarchy is a great way to analyze the development or the evolution of a product over time. They highlight your product development project’s goals, milestones, and deliverables.
38. 3 Stage Bar Chart
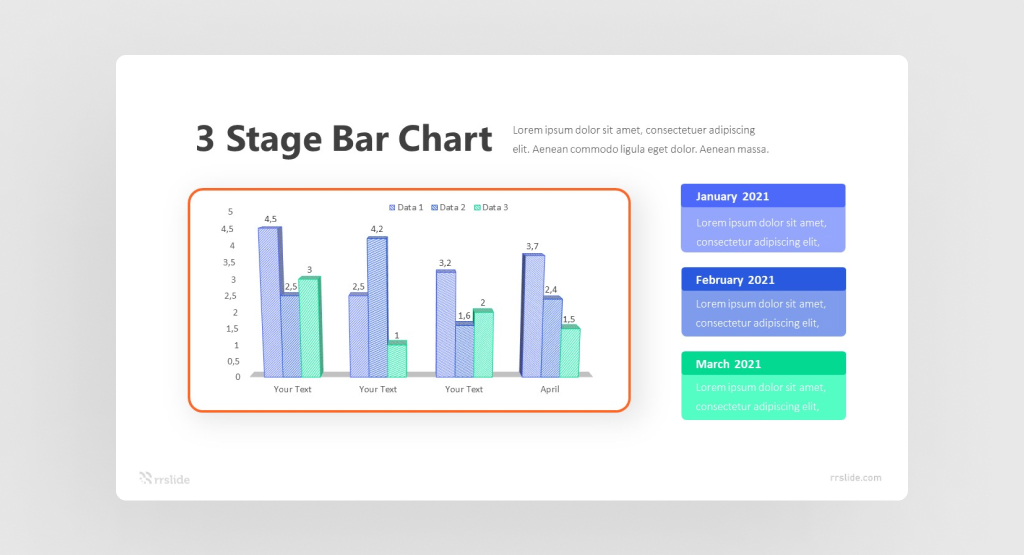
3 Stage Bar Chart organizes information into a graphic using bars of different lengths. The length of these bars is proportional to the size of the information they represent. For example, a vertical bar graph shows the different information among a group.
With bar charts, you can compare statistics groups with just a glance. One axis specifies the groups, while the other quantifies their count. The goal is to show big differences between the groups, such as which price points customers buy more and which media platforms lead new customers to you.
39. Free PowerPoint Infographics Pack: Pert Chart Diagram
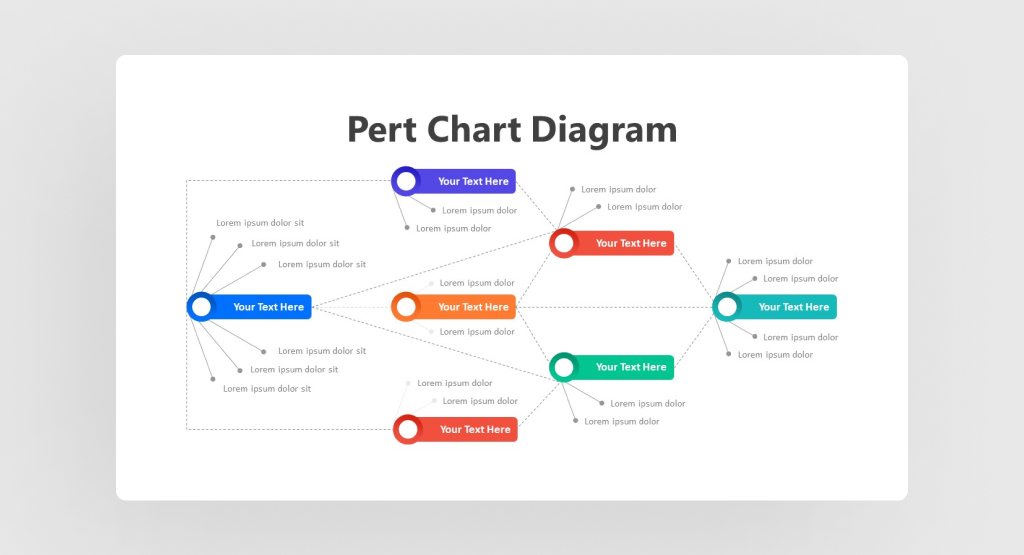
If you’ve ever struggled with mapping project tasks or keeping track of dependencies, we have the perfect solution for you. A Pert Chart Diagram, also known as a Pert Diagram, is a tool used to schedule, organize, and map out tasks within a project. Pert stands for program evaluation and review technique. It provides a visual representation of a project’s timeline and breaks down individual tasks. These charts are similar to Gantt charts but structured differently.
A Pert Chart Diagram works by visually representing a project’s tasks and the dependencies connected to each one. You might use one to create an initial schedule and estimated timeline to share with project stakeholders before the project actually begins. This diagram consists of steps to get you from a project start date to an end date. In this article, we’ll cover the five steps, show you an example, and explain how to use a Pert Chart Diagram to your advantage effectively.
40. Free PowerPoint Infographics Pack: 8 Step Tube Infographic
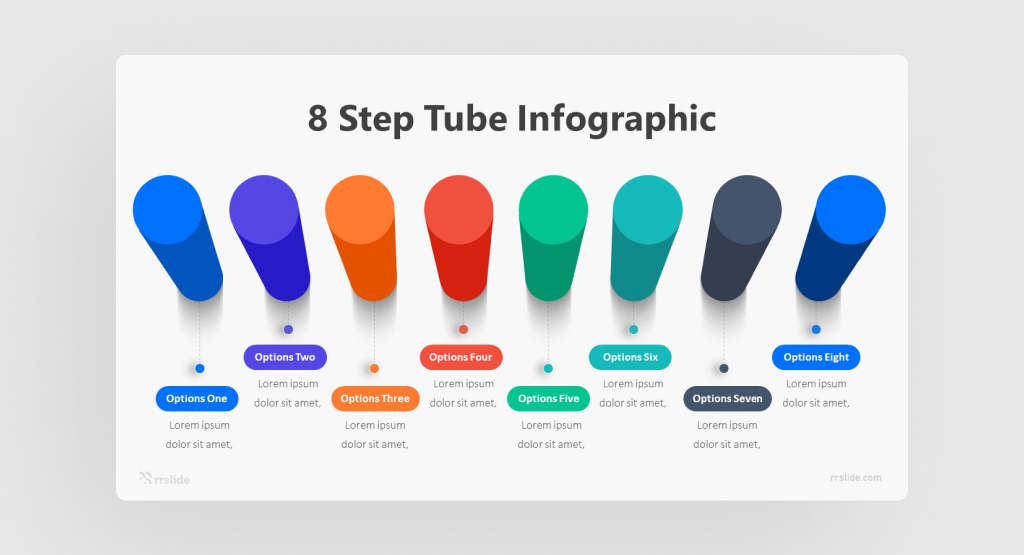
The 8 Step Tube Infographic is perfect for presentations about medical equipment, marketing plans for drug companies, and medical conventions. The medical industry needs greater presentations and visual impact. This is created as a better means of communicating ideas to a wider audience. It’s an intriguing mode of advertisement that can easily spark interest for complex campaigns.
Generally, this type of presentation tells the whole story of a theory, campaign, and any other company or non-business PowerPoint templates. Another characteristic of infographics is its ability to deliver messages without many words or texts. The story or messages it represents rely heavily upon familiar yet meaningful illustrations. In a presentation using infographics, the speaker’s statements only add more sense and enlightenment to the illustrations.
41. Free PowerPoint Infographics Pack: 5 Stage Tube
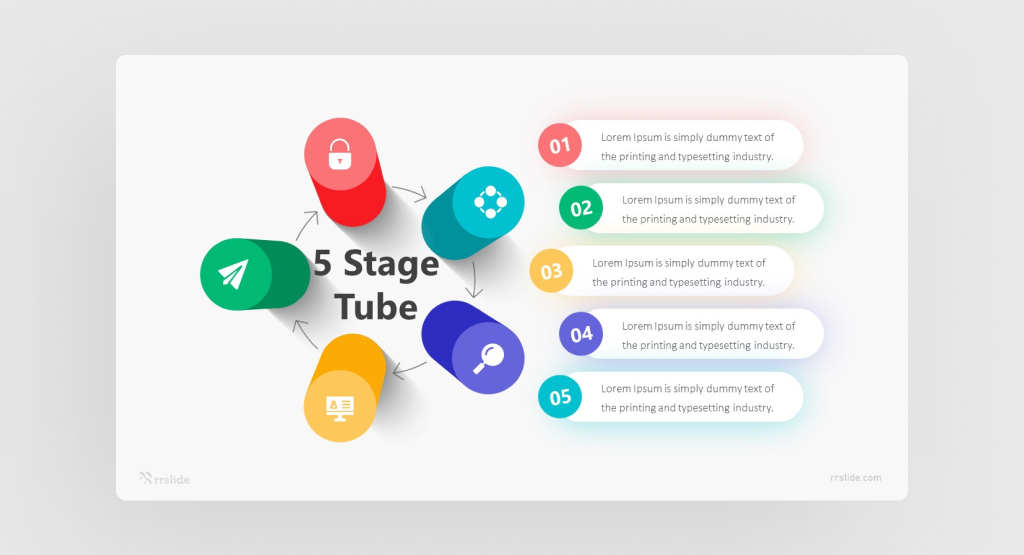
Download 5 Stage Tube for PowerPoint presentations consisting of different types of diagrams. It has a theme color applied. The shapes and text in the slides are 100% editable. This is a diagram with sets of statistics to be compared to make decisions. This is a usual cycle diagram that shows the connections between each phase. This is used to illustrate the continuous and repetitive technique. It can show a continuing sequence of stages, steps, or tasks.
42. Free PowerPoint Infographics Pack: 4 Step Banner Infographic
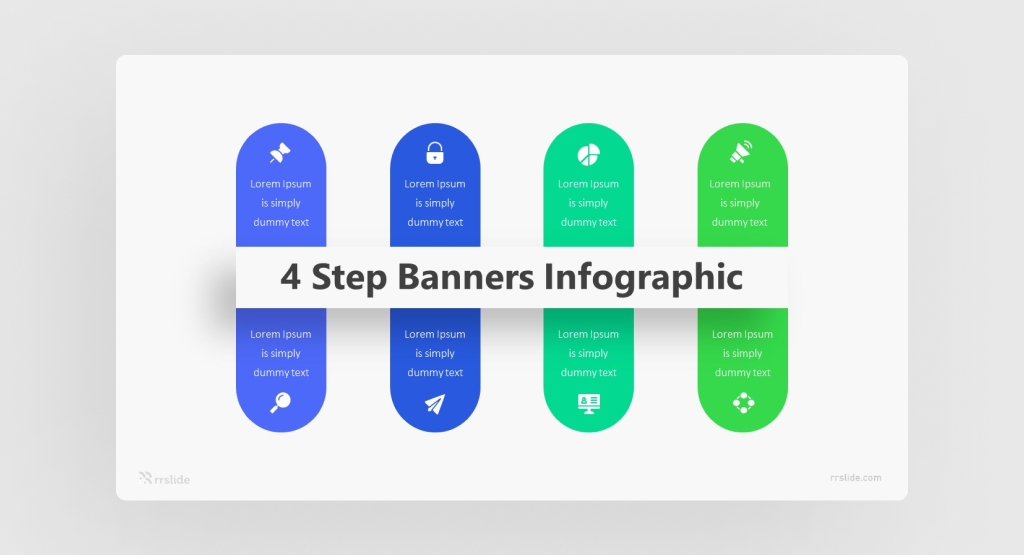
4 Step Banner Infographic is a list of tube banners with icons. Here are four different infographic ideas to kickstart your design thinking. This diagram is for the PowerPoint template with a light bulb design. Just imagine slides carefully designed for your quick and efficient work. A complete set of all vector diagrams are infographics you need to turn your words visually into a clear, eye-catching presentation.
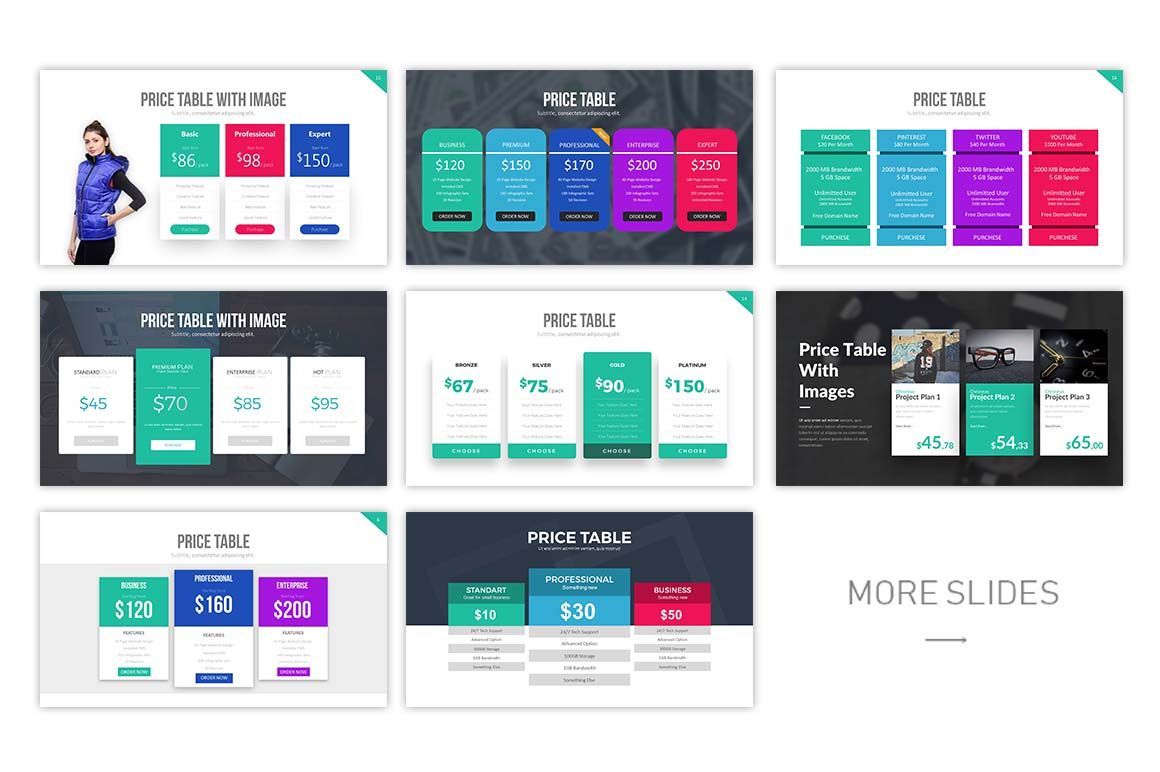
43. Free PowerPoint Infographics Pack: Price Table
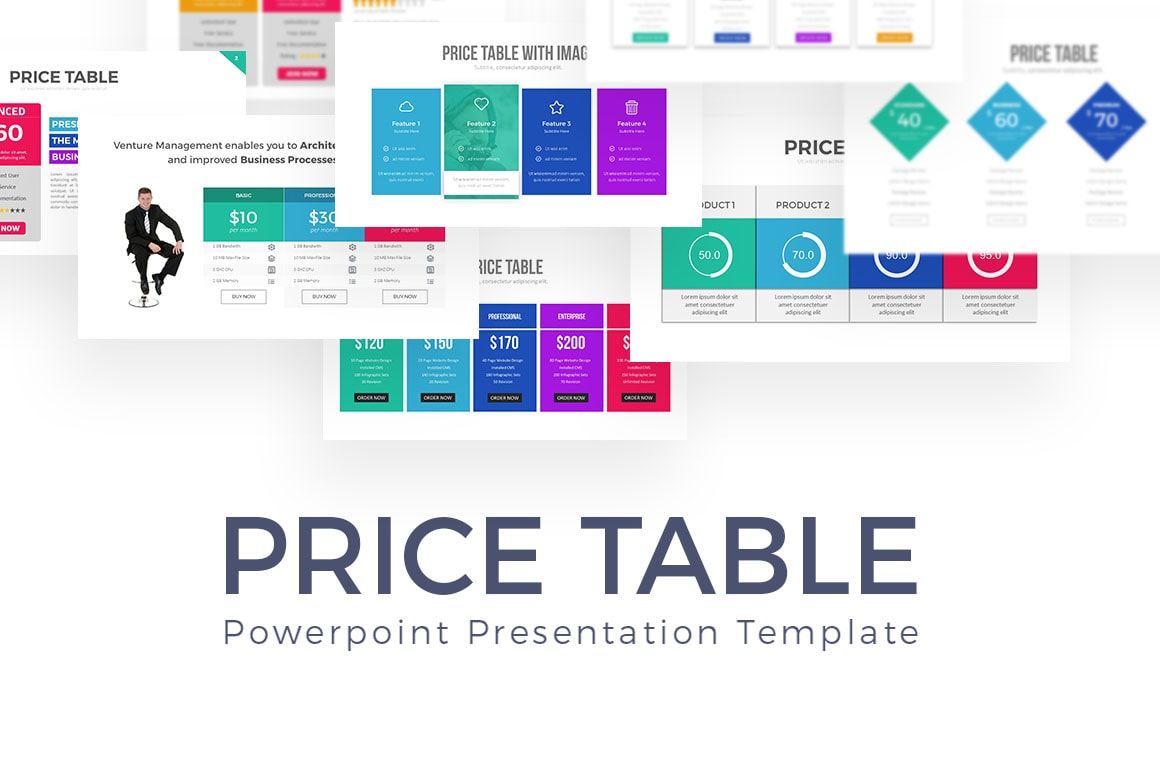
If your business is about producing products, services, projects, events, and many more, you must use this infographic template PowerPoint. Price table PowerPoint templates are best for you; price tables are presented with various layouts. The price table helps you present each product’s advantages, facilities, features, and prices. With dynamic animations, your presentation will look unique and exciting. You can also choose attractive color schemes, so company investors don’t get bored when they see your presentation.
Save the time you are using the price table charts assets!
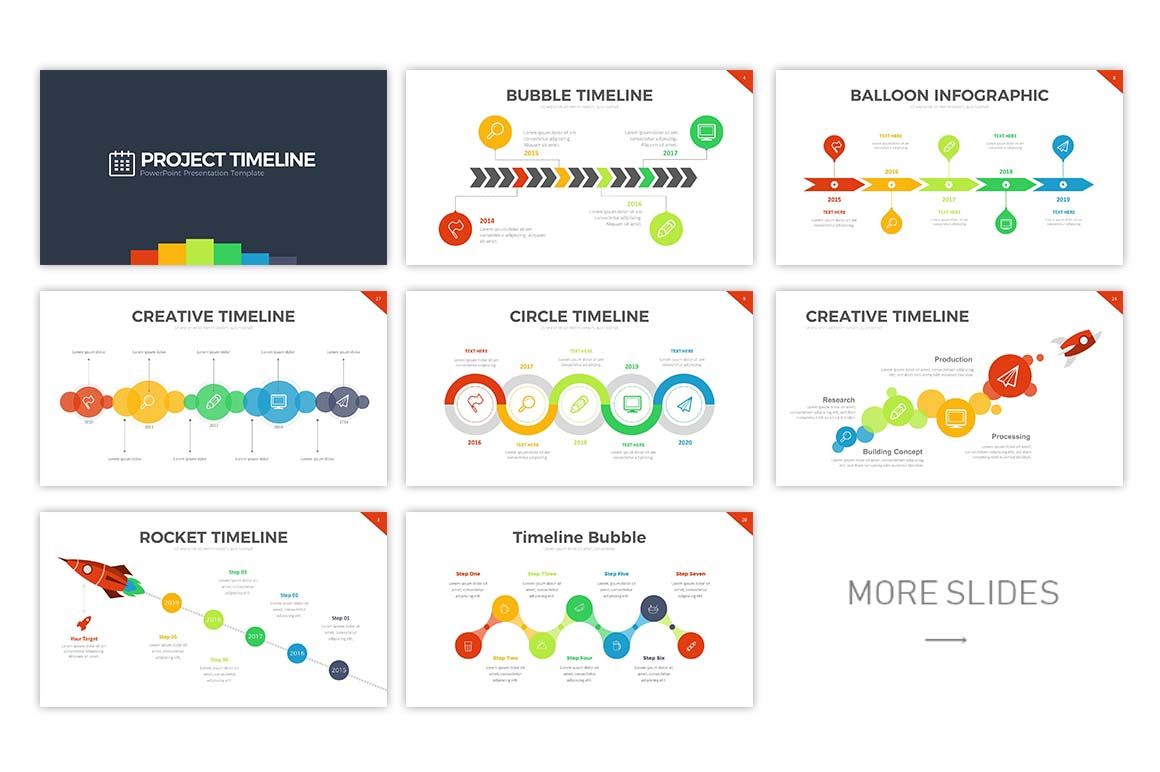
44. Free PowerPoint Infographics Pack: Project Timeline
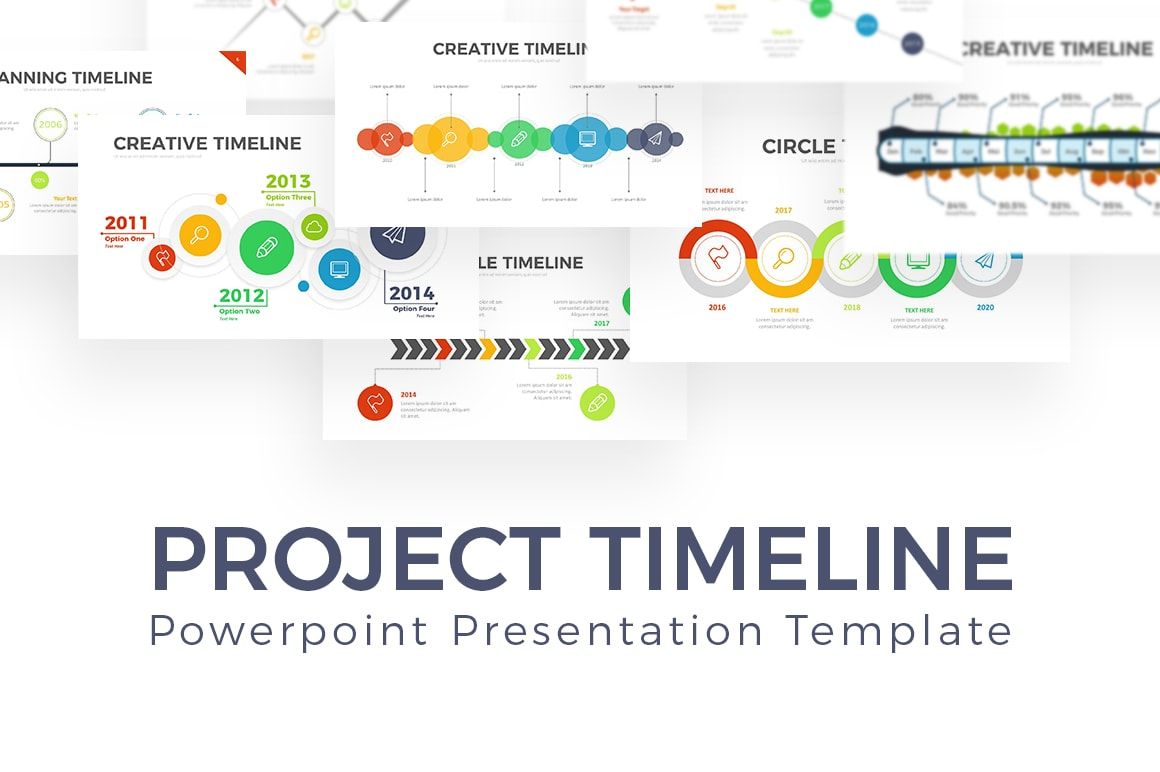
These infographics of PowerPoint template assets provide a unique graph for presenting corporation plans and plans for completing your project from month to month or year to year.
The timeline chart is diverse, including the editable infographics timeline, rocket timeline, bubble timeline, planning timeline, circle timeline, creative timeline, arrow timeline, road timeline, vertical timeline, horizontal timeline, project timeline, and many more. Complete right? If you have an asset project timeline PowerPoint, you don’t need to be confused again when presenting the timeline.
The project timeline is very creative and unique. The charts are cool, plus the fantastic animation makes this template get better. You can choose a light or dark version of this PowerPoint infographics and charts assets.
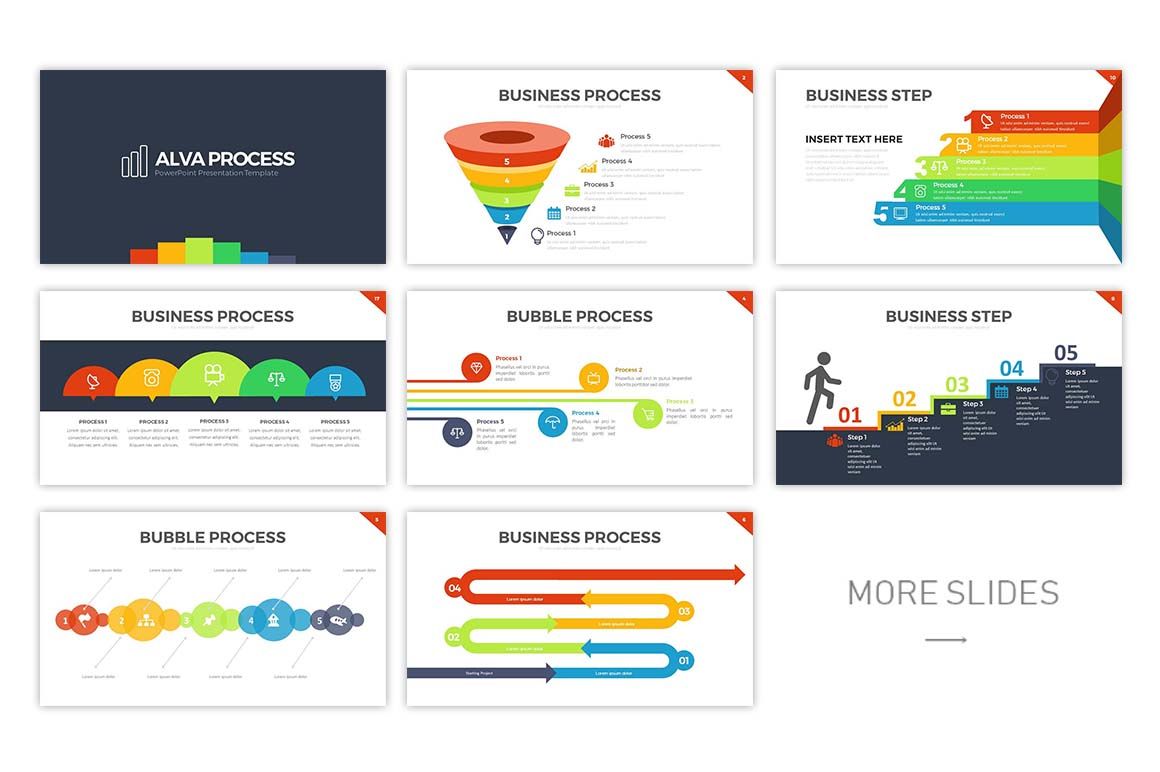
45. Free PowerPoint Infographics: Alva Process
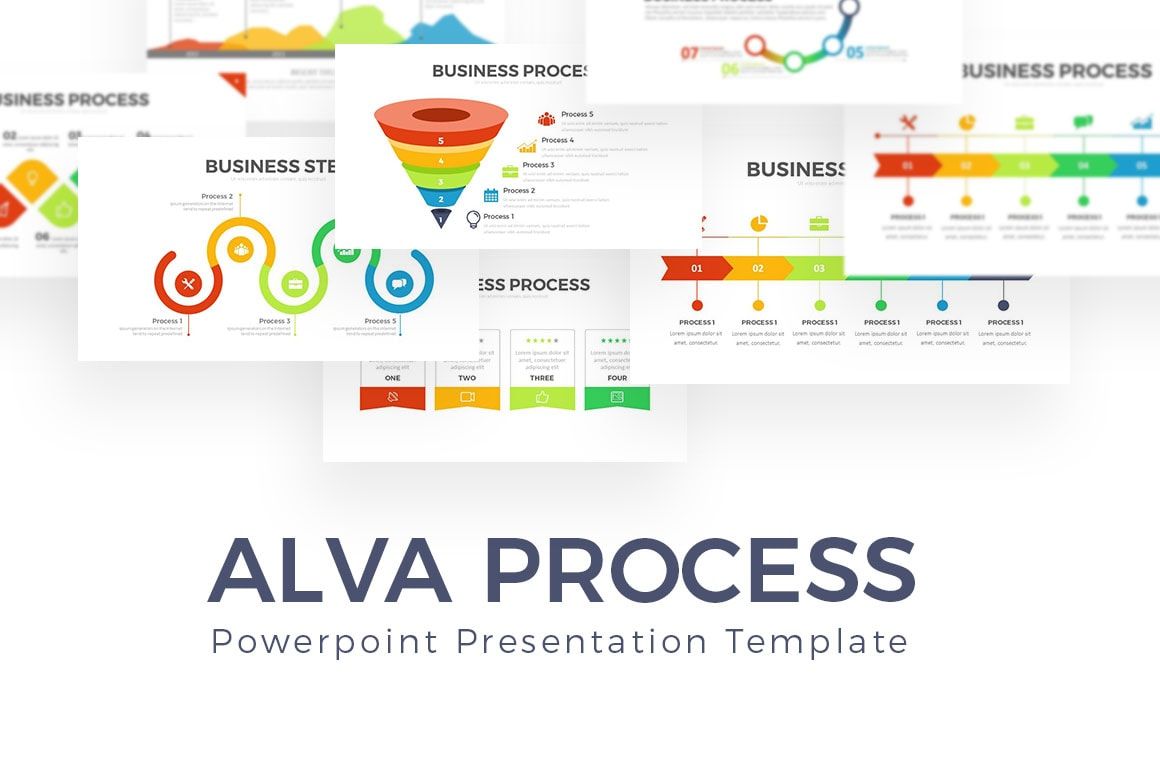
The template also has a light and dark version that you can choose from both for your template’s appearance to be more beautiful.
“Alva Process” is a handy template and has many benefits. From the beginning, the template maker is focused on the usage and beauty of all slides. This template provides 20 cycle infographics that support you in presenting company steps for your company. We have also set up colorful colors to make your audience or clients of your industry interested and fresh. If you want to replace it with another color scheme, it is possible. We have provided it.
If you are a manager who will present your business step, don’t be confused, this template is suitable and memorable for you!
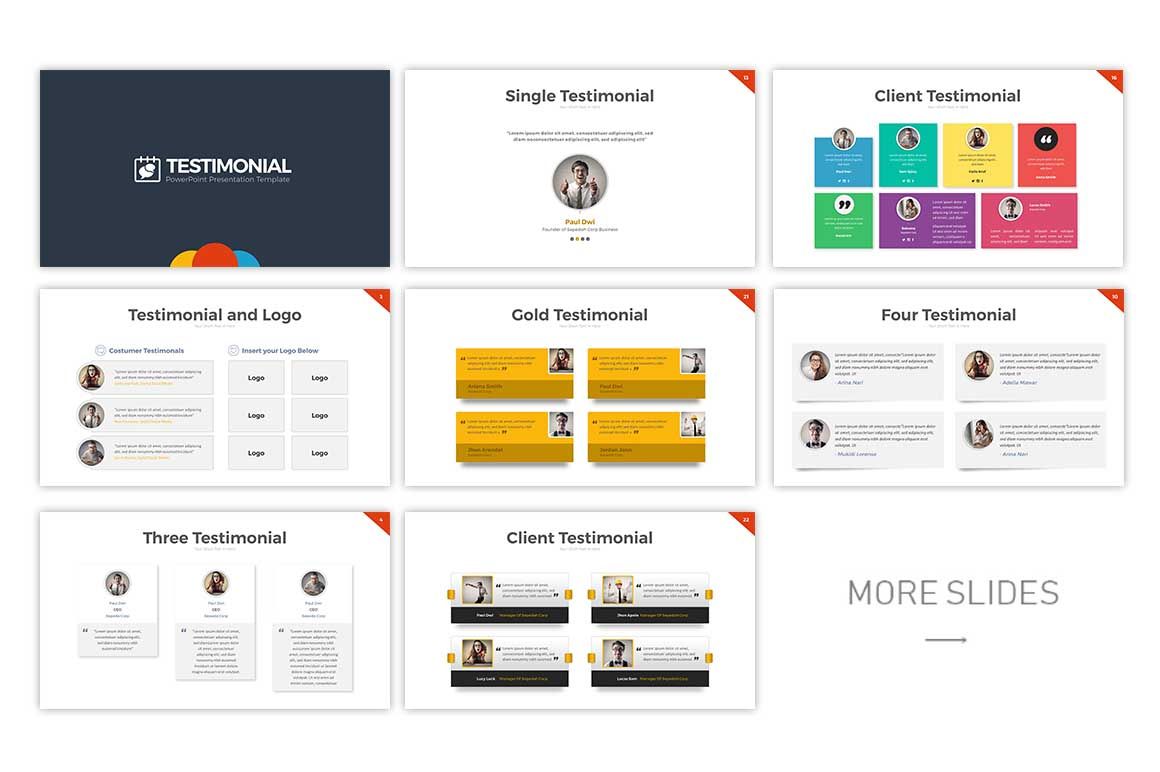
46. Free PowerPoint Infographics: Testimonial
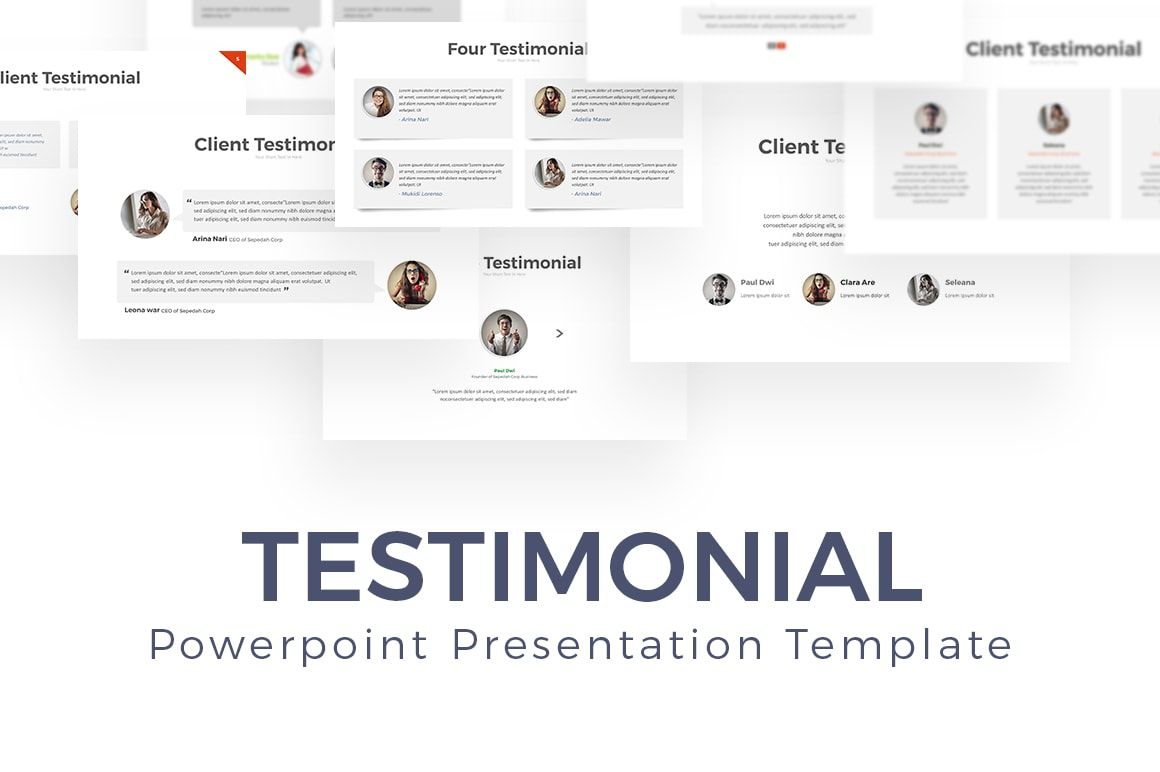
Powerpoint assets testimonials will help you present the testimonials given by your client or customer. Testimonials are needed to appreciate your product but want to understand your product, but it can also increase market expansion through consumers who give testimonials.
Testimonials Templates have a creative layout and a neat appearance that fits and matches if you want to give testimonials that you have received through consumers. This template has many innovative designs. You can also choose to use the light or dark versions according to your favorite!
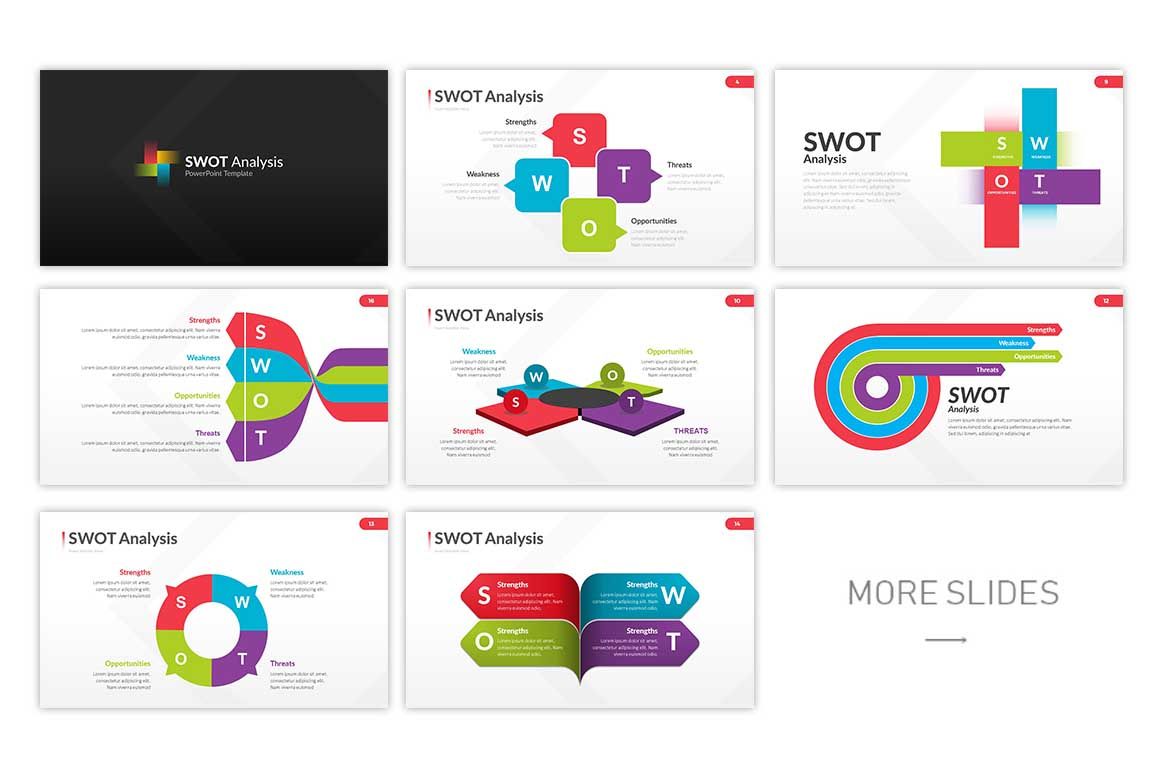
47. Free PowerPoint Infographics: SWOT Analysis
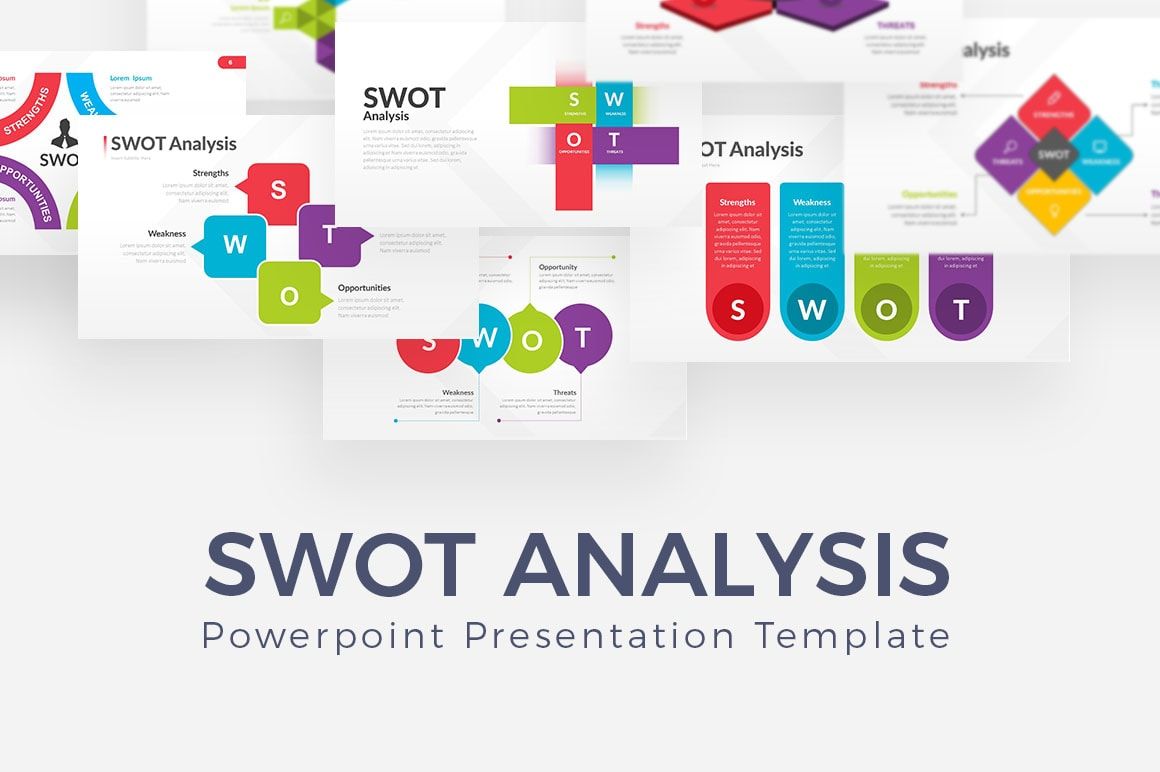
When you make a company profile, you will also need a SWOT analysis. SWOT Analysis Templates are especially for those who want to deliver your plan company or industry strategy through the SWOT method.
Do you want your presentation to look fascinating and not boring? Don’t worry because SWOT Analysis provides colorful colors that you can choose. Make a SWOT analysis of your company to make it look exciting and not boring with this template.
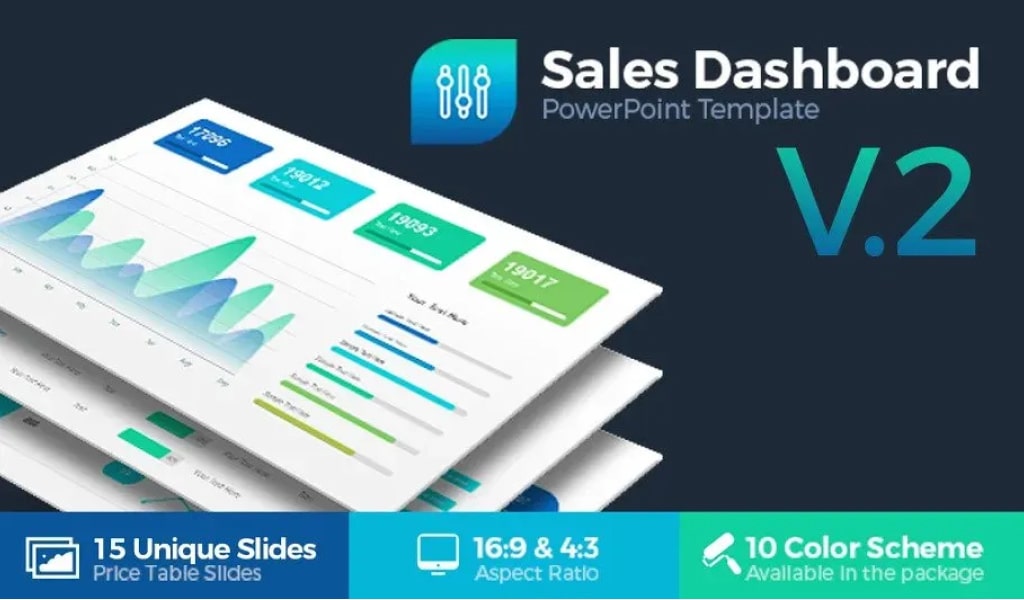
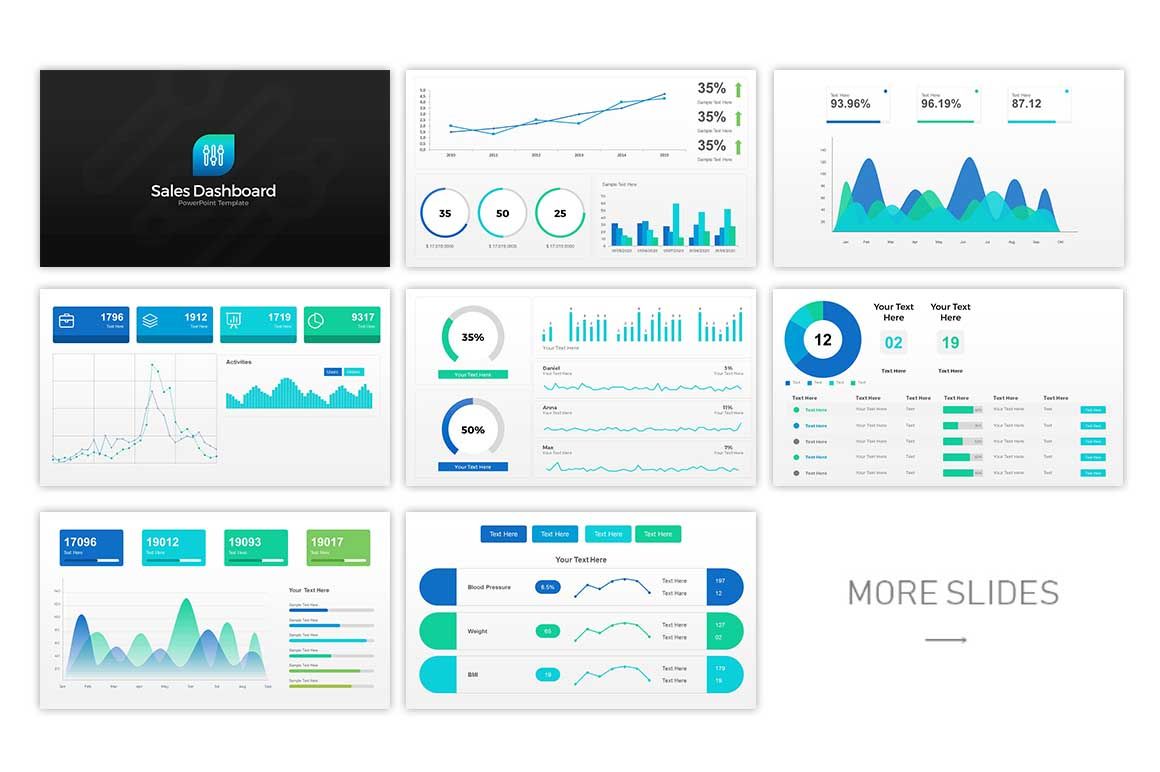
48. Sales Dashboard
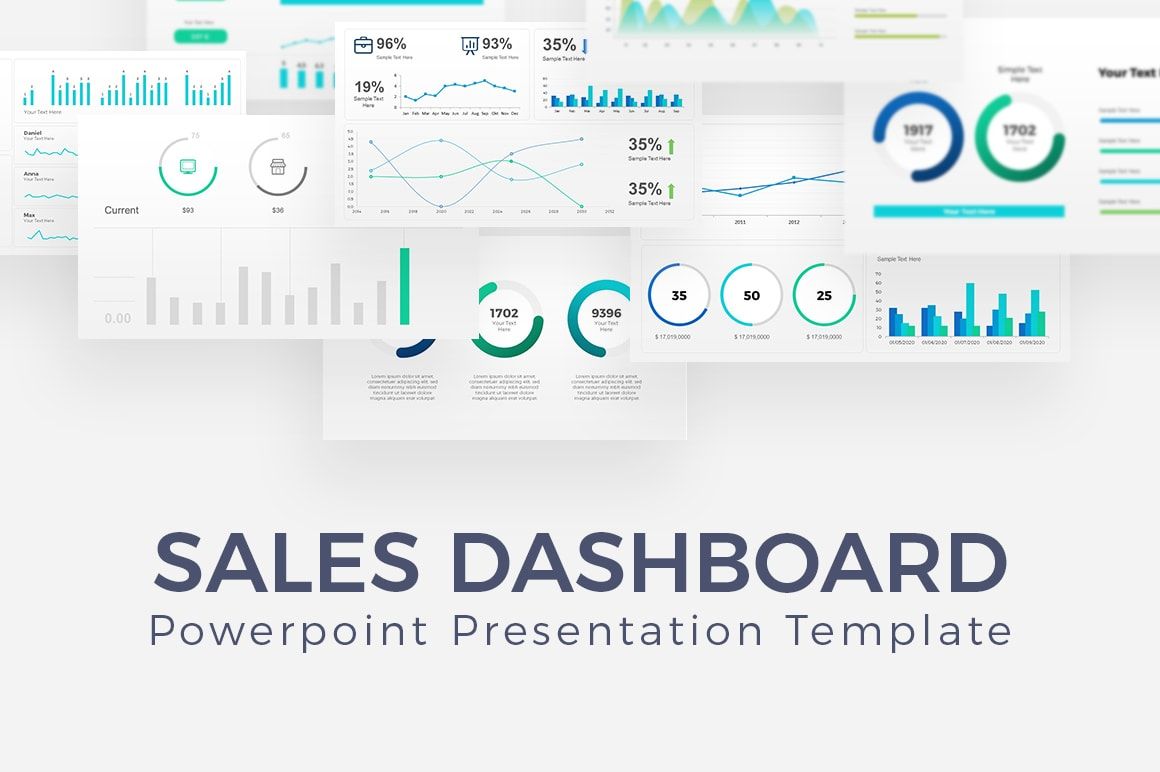
The sales dashboard template collection is a complete template to analyze or report your company’s development. The sales dashboard is essential for visualizing or setting sales or development databases into one graph display and conclusions. Every company must have a sales dashboard to explain its business.
The sales dashboard in this template has a comfortable and easy-to-see appearance. Using this template, the audience will be more comfortable reading reports, analyzing statistics, and predicting future data. This template provides diagrams that you can use to deliver your data. Audiences will be more pleased to see your presentation—light or dark versions are available here. So, download this as your PowerPoint asset!
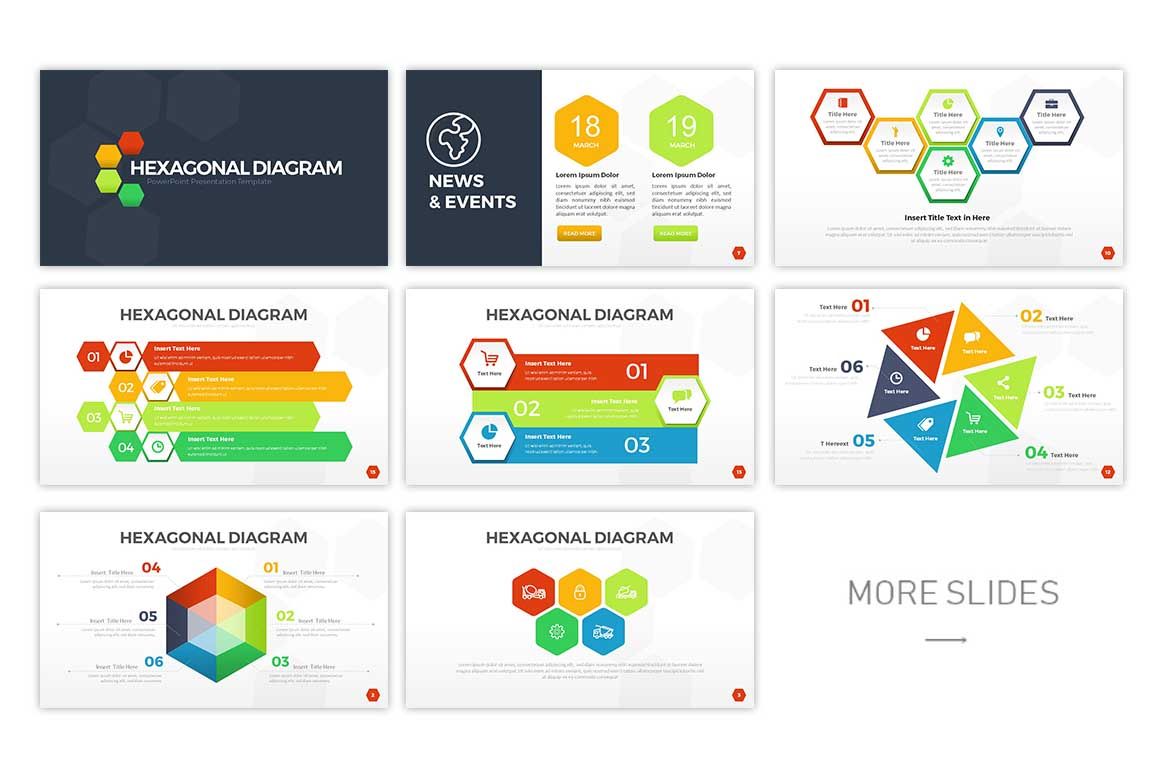
49. Hexagonal Diagram
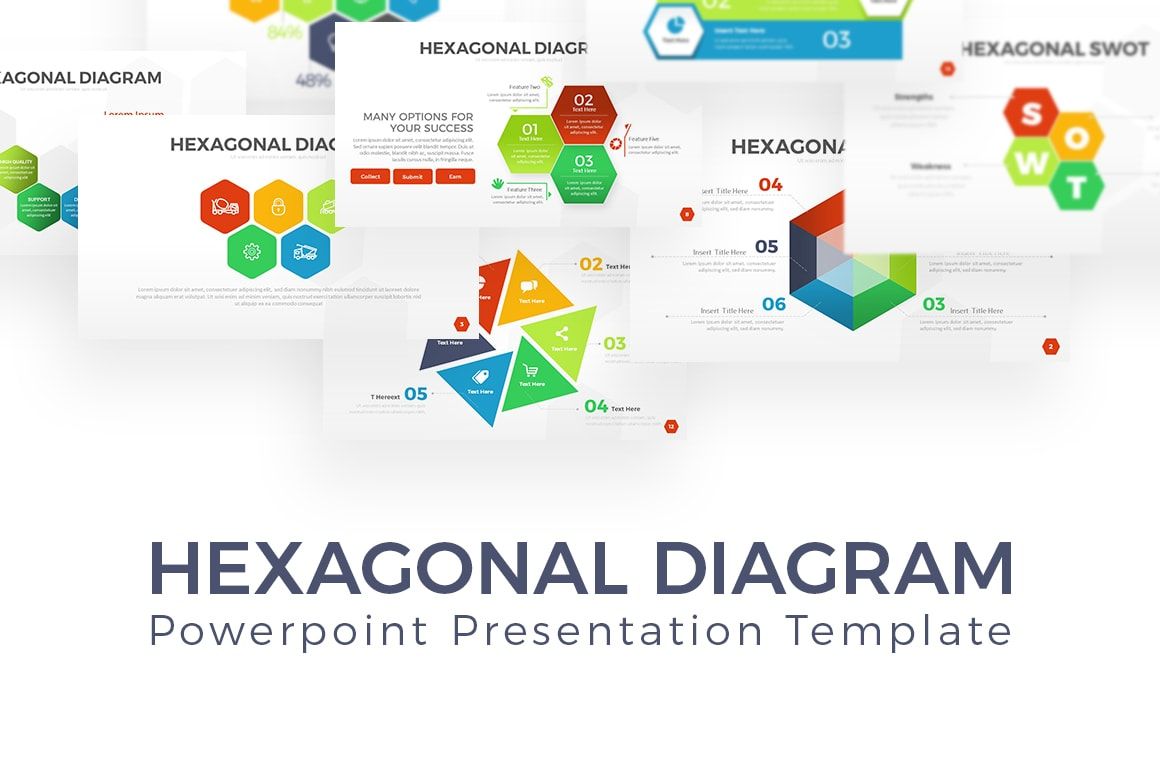
The hexagonal shape has a dynamic, regular appearance, and a modern look, plus colorful colors, making this diagram even more interesting to see. Hexagonal charts have diverse presentations, presented creatively and neatly. Each hexagonal map has its peculiarities in each presentation and uses. You can explain company statistics, news and events, and swot analysis about your company, which is presented with hexagonal diagrams, making it more concise, and more things you can offer here.
Do you like the hexagonal shape? Hexagonal Diagram Hexagonal templates are suitable for your data analysis. The chart is provided from this template. The statistics initially look complicated, but data analysis will look very easy if you use this template. Your audiences will feel light with beautiful images and even get heavy material.
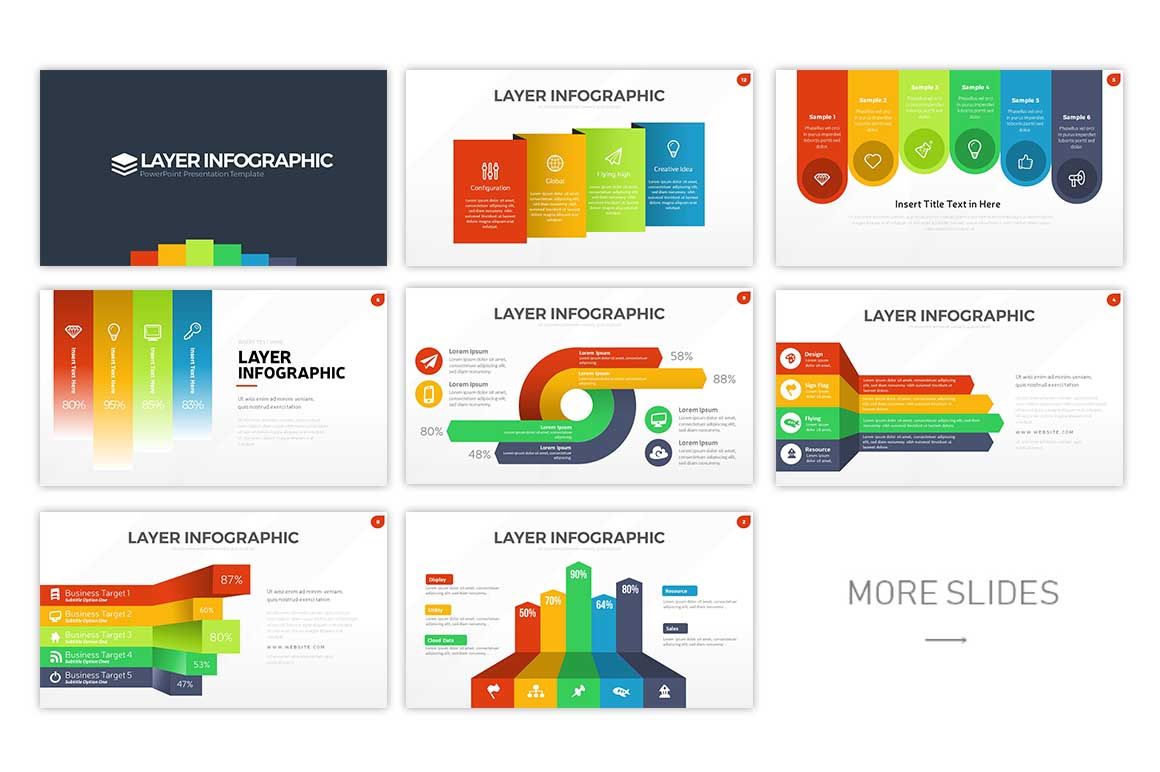
50. Layer Infographic
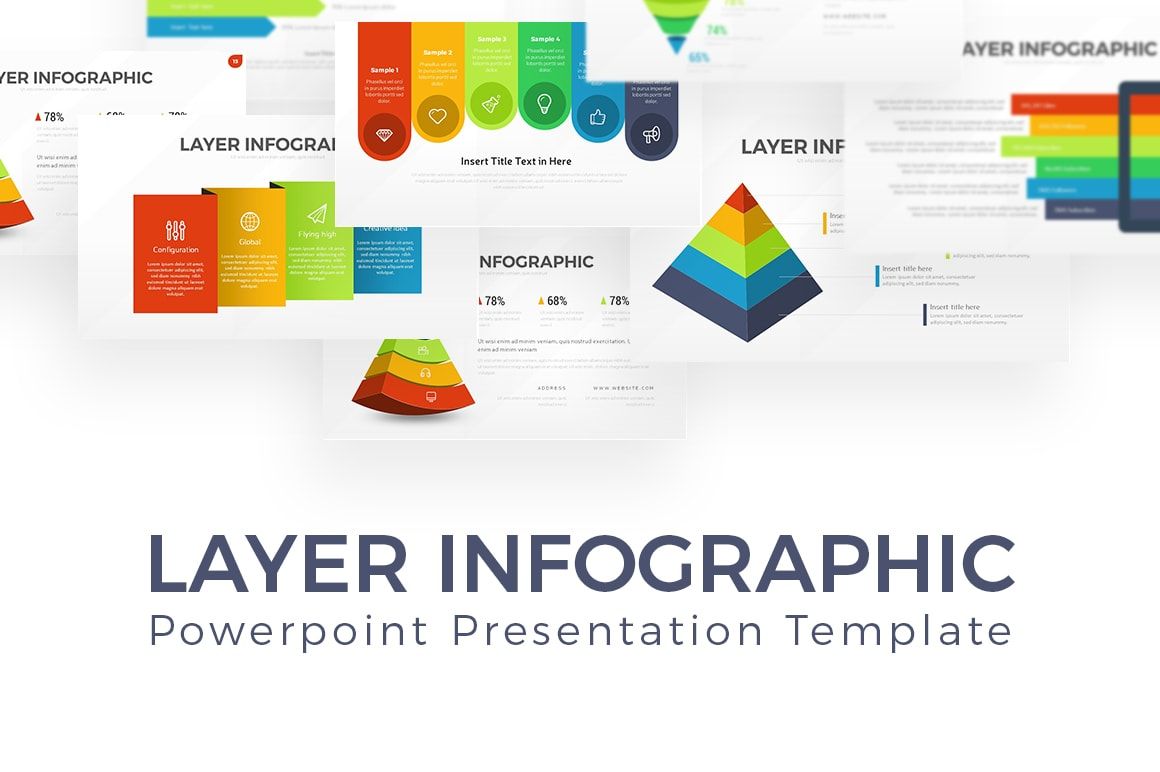
The infographic layer has an infographic presented with layering that you can display attractively. Layering has its way of making the data you provide look more concise. Shape layering is very creative and exciting. If you need an infographic layer, use this template. You can choose the infographic templates that match the data and match your favorite.
A company will always need infographic slides that support the company’s presentation. A company will require an infographic that can demonstrate the business development company, what plans the company will do, the percentage of the company’s plans to be done, and the list that your company needs to show. These infographic PowerPoint templates are available on the Layer Infographic template with a unique and creative design icon. This template also includes a color scheme; choose your favorite color!
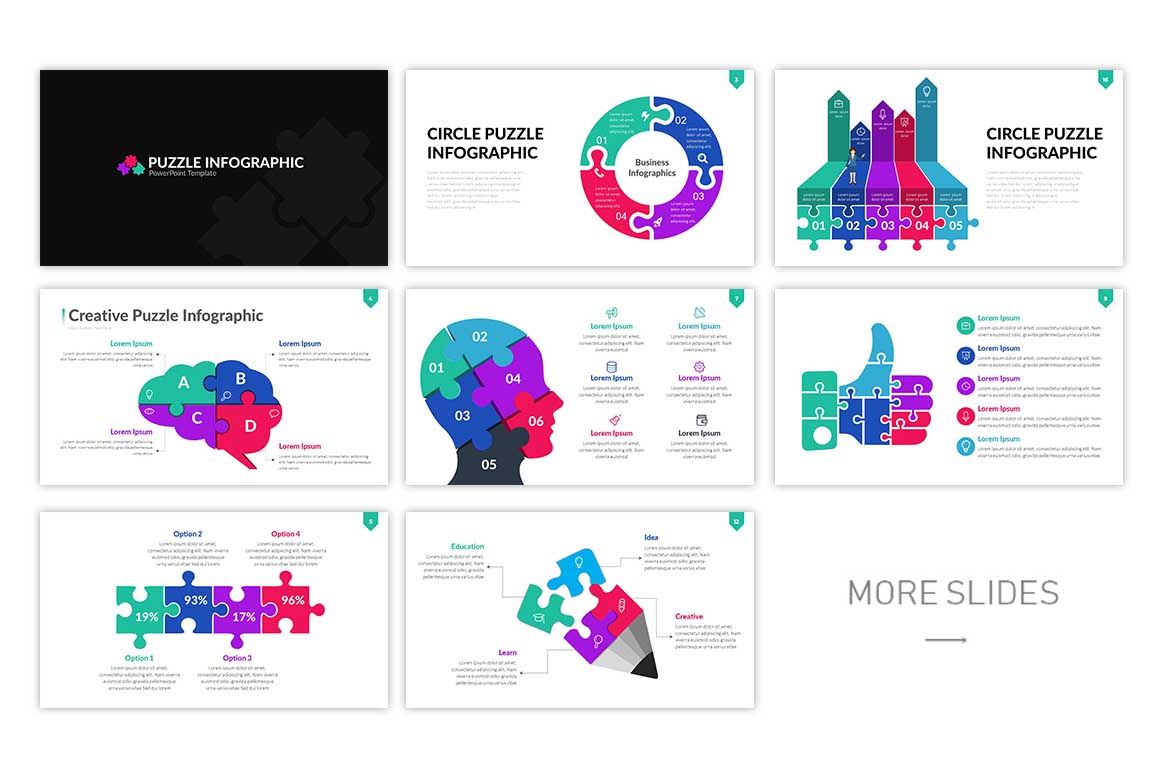
51. Puzzle Infographic
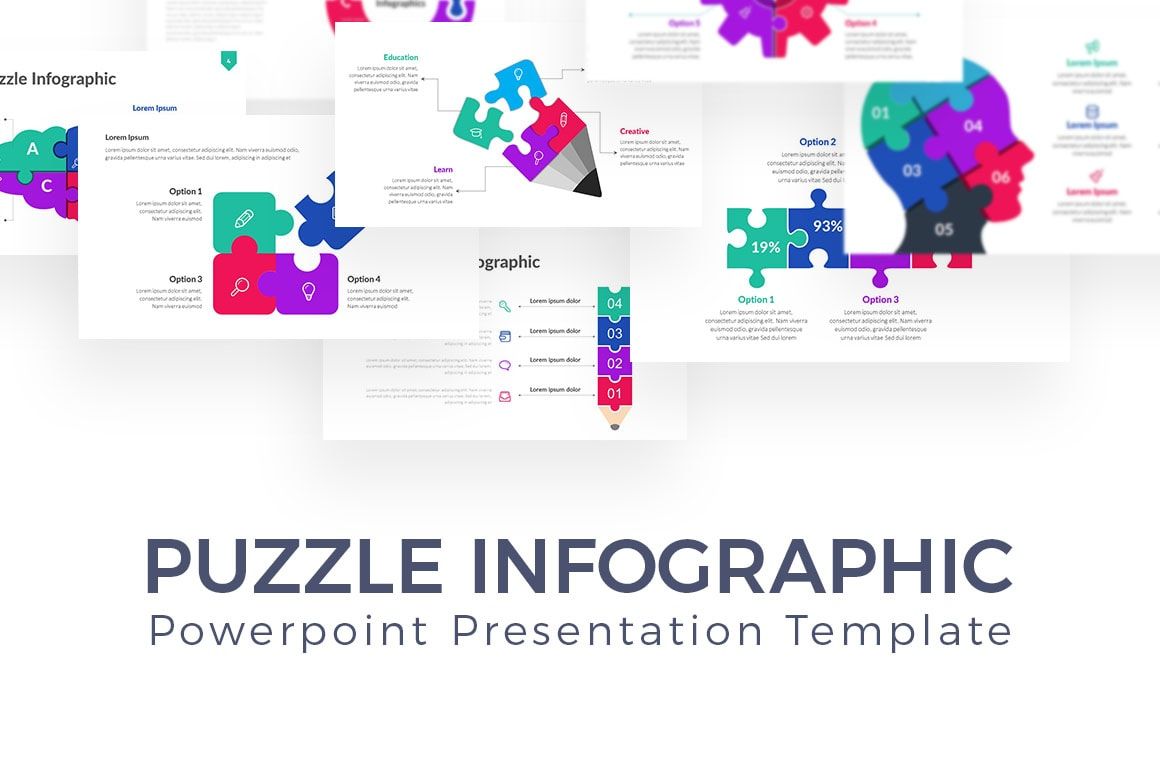
Puzzle Infographic Template is a template that has many infographic PowerPoint templates, combined with puzzle shapes. It will be easy to introduce information or data with infographics contained in this template. The infographic puzzle presentation is diverse; namely, there are infographic puzzle circles, creative puzzles infographic templates, puzzles that make up the brain, thumbs, wheels, pencils, and many more. A fully customizable puzzle infographic allows you to use a light version, a dark version, or colorful color schemes with many options. You can download any of your infographics and match your data. You can also choose the color scheme that is already available.
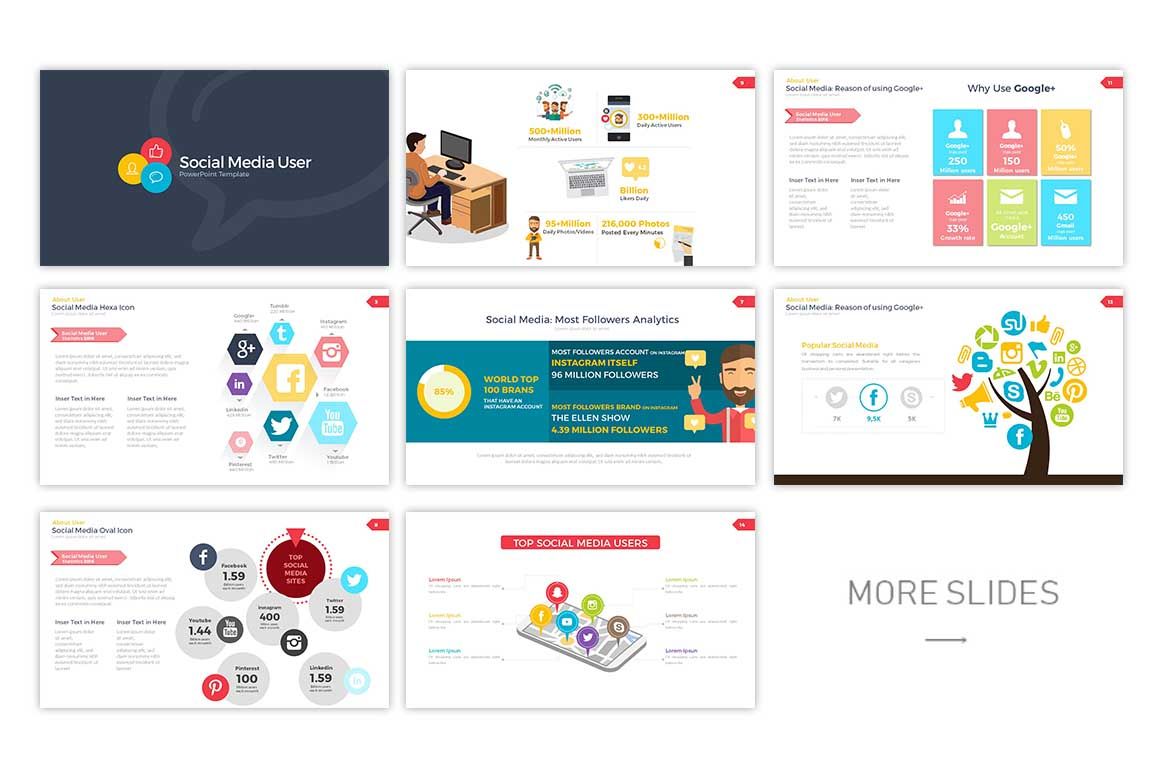
52. Social Media Infographic
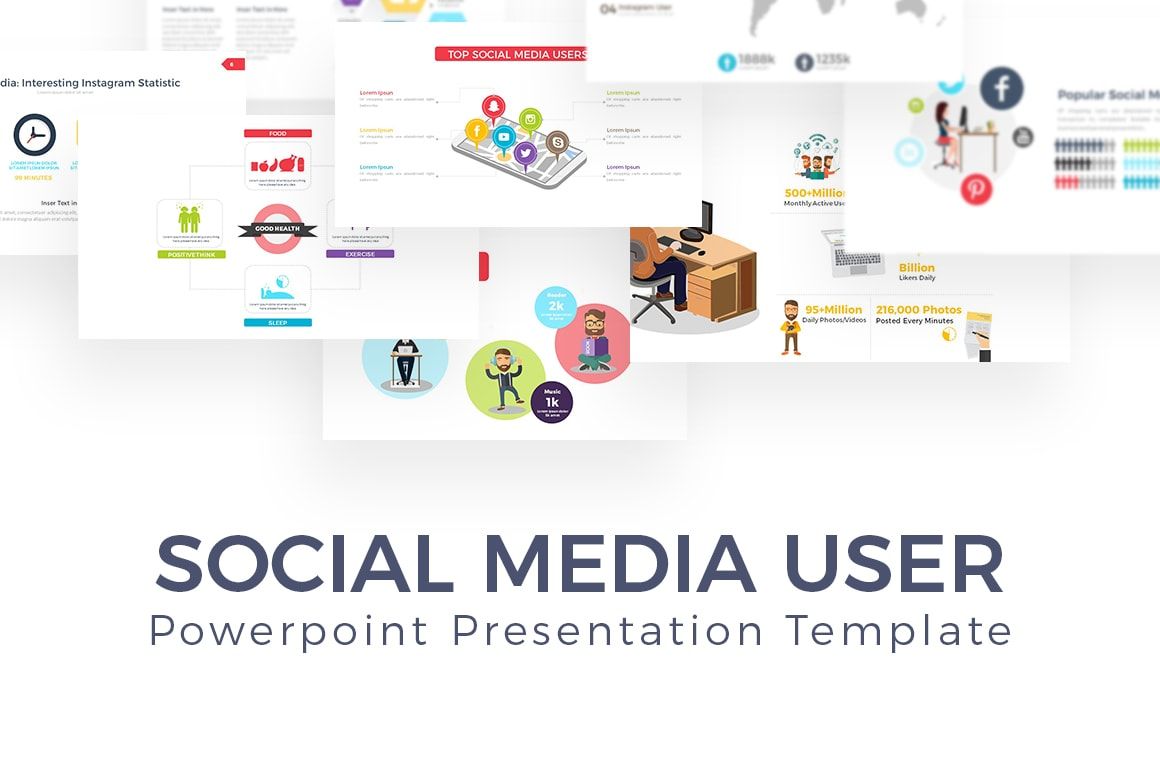
Social media infographic templates are an infographic that is hard to find and rarely found. Infographics social media has many benefits, such as for your company when it will show business developments in each social media or working on a next presentation related to digital marketing or social media strategies. So, immediately purchase these social media infographics to make your company’s power asset. This template is especially for you.
Analyze some of your social media accounts, and compare them from various aspects. You can show it through this template. Social Media User Templates have much information for a comparative analysis of social media, in terms of gender, country territory, number of followers, likes, and comparison of the popularity of each social media. You can choose a light or dark version or an attractive colorful color scheme. Don’t hesitate when presenting about social media. You can download this template for creating presentations with brilliant ideas.
See also:
How to Create a Workflow Diagram for Business
Free Multipurpose Business PowerPoint Templates
Free PowerPoint Presentation Templates vs Premium Items
6 Reasons Why Infographics Are Important for Your Professional PowerPoint
Every free PowerPoint infographic template pack has its function in your presentation
Your business will have the perfect asset for presentation when you have these PowerPoint assets and Google Slides presentations. With layouts, various forms presented creatively, and colorful colors, you will have eye-catching visuals in your PowerPoint templates and Google Slides. Many different forms of designs will make it easier for you to choose the one that matches the data you are presenting. When you customize this template with the file you provide, everything will be easy and, in a short time mesmerize the audience’s attention. So, let’s use the free PowerPoint infographics above to add complex data to your excellent business presentation slide!
Get unlimited access to many categories for PowerPoint, Keynote, and Google Slides themes.
Let’s visit RRPicks to download free PowerPoint templates. But wait, don’t go anywhere and stay here with our Blog to keep up-to-date on all the best pitch deck template collections and design advice from our PowerPoint experts yet to come!